Open Access
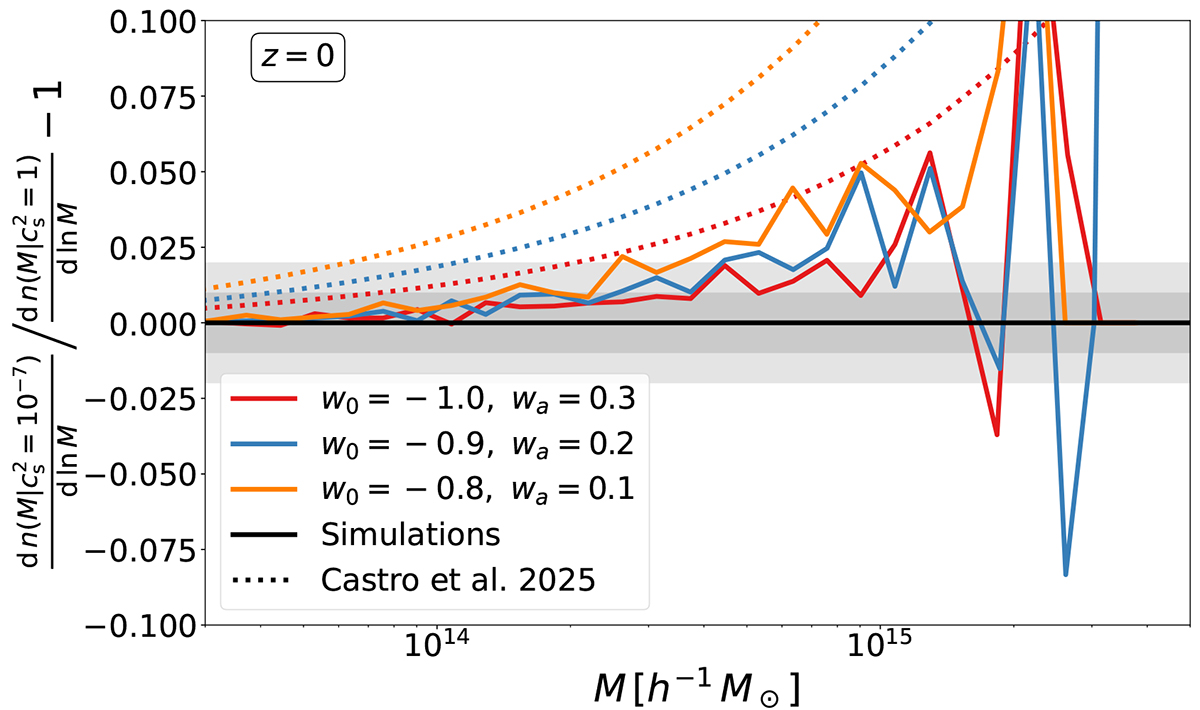
Fig. 3.
Download original image
Relative differences in the HMF at z = 0 for the case where cs2 = 10−7, compared to the reference case cs2 = 1, for different DE EOS parameters (filled lines in different colors). The figure also shows the prediction of this quantity from our baseline model, presented in Paper I, as indicated by the dotted lines.
Current usage metrics show cumulative count of Article Views (full-text article views including HTML views, PDF and ePub downloads, according to the available data) and Abstracts Views on Vision4Press platform.
Data correspond to usage on the plateform after 2015. The current usage metrics is available 48-96 hours after online publication and is updated daily on week days.
Initial download of the metrics may take a while.