Fig. 4.
Download original image
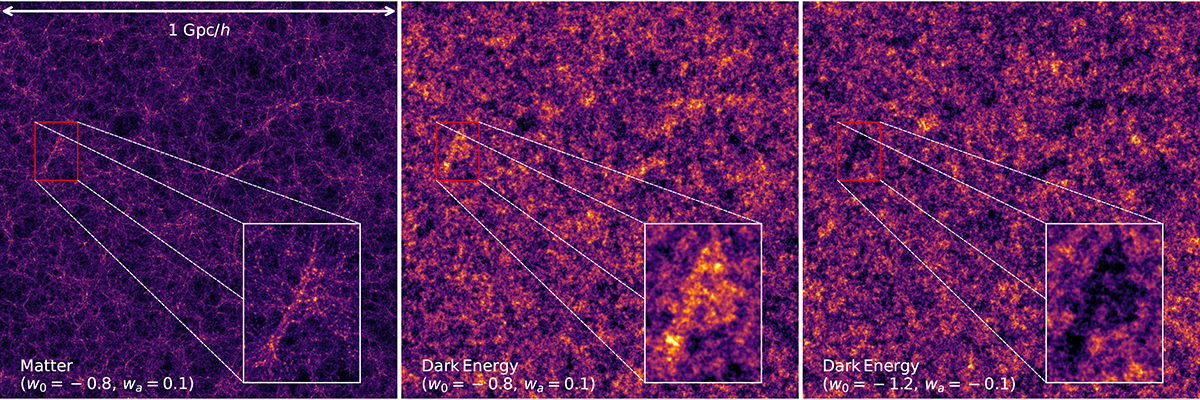
Density fields in a comoving volume of size 1 Gpc/h at z = 0. Left: Matter distribution for simulation 3, i.e., w0 = −0.8 and wa = 0.1. Middle and right: DE distributions for the same simulation and its phantom twin (w0 = −1.2, wa = −0.1), respectively. A zoomed-in view of the region inside the red rectangles is displayed in an inset at the lower right.
Current usage metrics show cumulative count of Article Views (full-text article views including HTML views, PDF and ePub downloads, according to the available data) and Abstracts Views on Vision4Press platform.
Data correspond to usage on the plateform after 2015. The current usage metrics is available 48-96 hours after online publication and is updated daily on week days.
Initial download of the metrics may take a while.