Open Access
Fig. 1.
Download original image
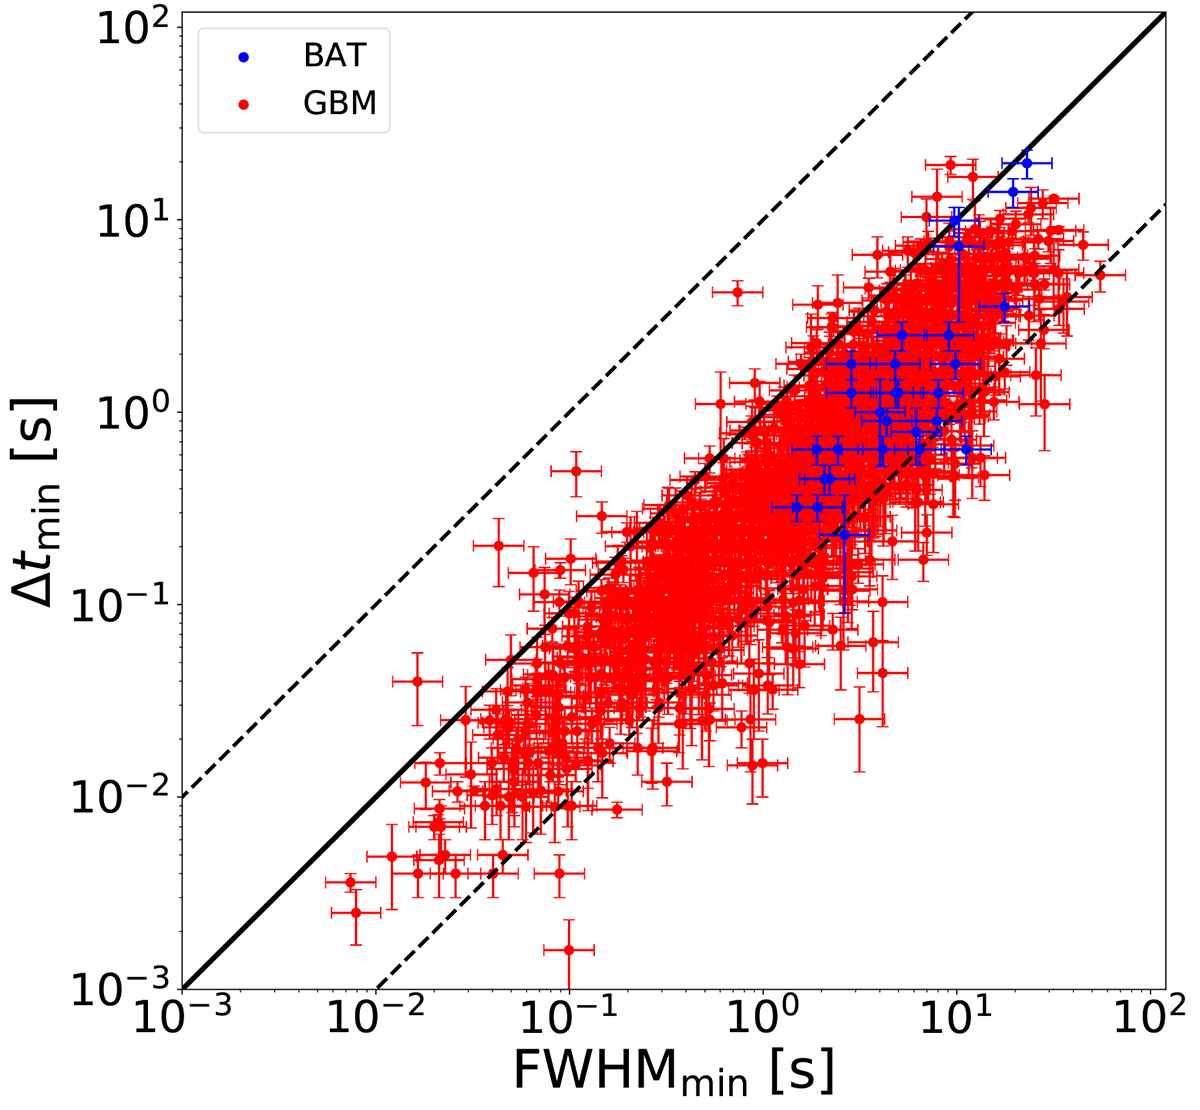
Plot representing Δtmin versus FWHMmin for the GRBs in common. Red points show GBM data, where Δtmin was taken from G15 and V23, while blue points are BAT data, with Δtmin being taken from Golkhou & Butler (2014). Equality is shown with a solid line, while dashed lines show ±1 dex.
Current usage metrics show cumulative count of Article Views (full-text article views including HTML views, PDF and ePub downloads, according to the available data) and Abstracts Views on Vision4Press platform.
Data correspond to usage on the plateform after 2015. The current usage metrics is available 48-96 hours after online publication and is updated daily on week days.
Initial download of the metrics may take a while.