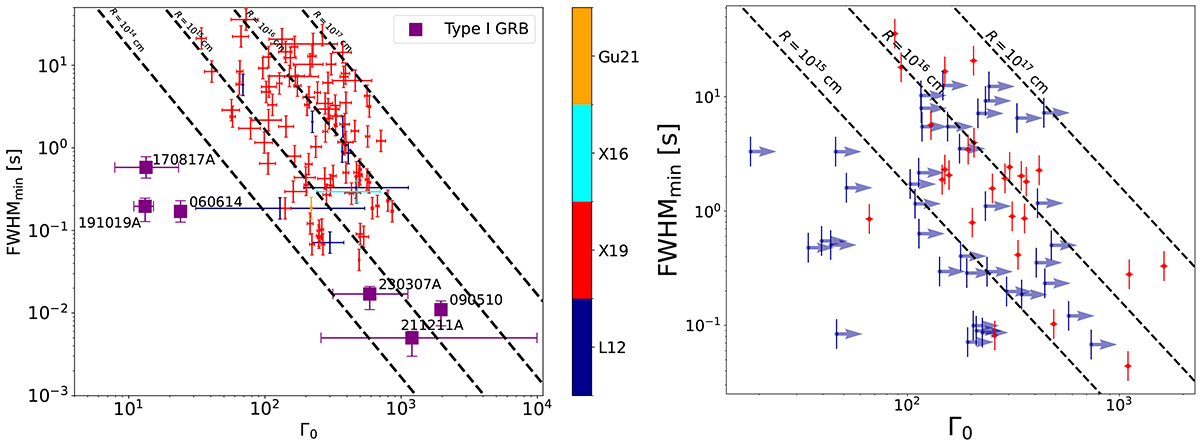
Fig. 11.
Download original image
For the Type-II (red dots) and Type-I GRBs (purple squares) present in our sample, FWHMmin versus the initial Lorentz factor Γ0. In the left panel, the Γ0 values are from different datasets and colour-coded as follows: L12 Lü et al. (2012), X19 Xue et al. (2019), X16 Xin et al. (2016), and Gu21 Gupta et al. (2021). The dashed lines represent the typical distance ![]() where the dissipation process responsible for the prompt emission could occur. The right panel is the same as the left, but Γ0 has been calculated using the dataset from Ghirlanda et al. (2018). Red points indicate GRBs from their golden and silver samples, while blue points represent lower limits on Γ0.
where the dissipation process responsible for the prompt emission could occur. The right panel is the same as the left, but Γ0 has been calculated using the dataset from Ghirlanda et al. (2018). Red points indicate GRBs from their golden and silver samples, while blue points represent lower limits on Γ0.
Current usage metrics show cumulative count of Article Views (full-text article views including HTML views, PDF and ePub downloads, according to the available data) and Abstracts Views on Vision4Press platform.
Data correspond to usage on the plateform after 2015. The current usage metrics is available 48-96 hours after online publication and is updated daily on week days.
Initial download of the metrics may take a while.