Fig. 12.
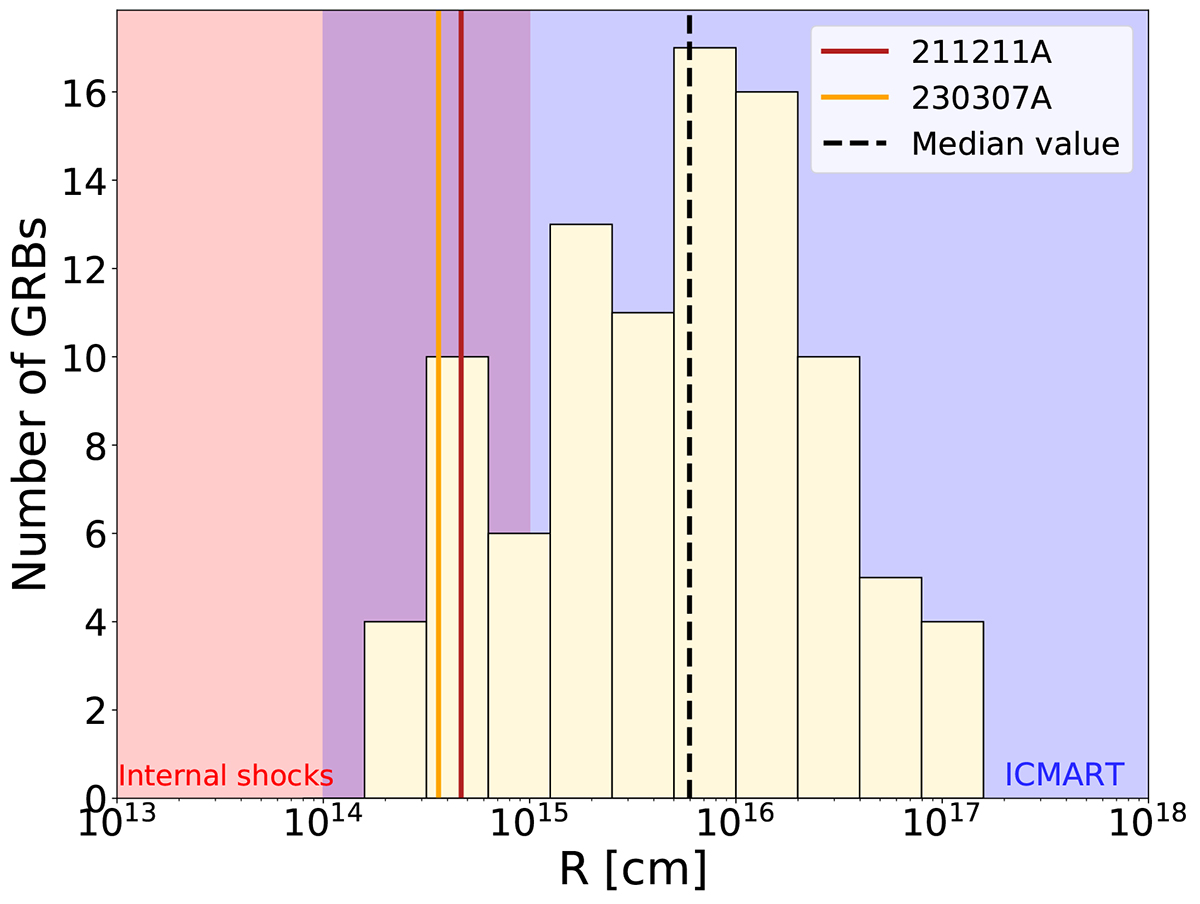
Download original image
Source emission region radii for the GBM sample. The red and orange vertical lines represent the value of this radius for 211211A and 230307A, while the dashed vertical line represents the median value of the distribution. The red shaded regions indicate the values expected by the IS model (1013 cm ≲ R ≲1015 cm; Rees & Meszaros 1994; Daigne & Mochkovitch 1998), while the blue one indicates the expectations for the ICMART model (R ≳ 1014−15 cm; Zhang & Yan (2011)). In the decade 1014 − 15 cm (purple), the two regions overlap, and the emission radii in this region are marginally compatible with both models.
Current usage metrics show cumulative count of Article Views (full-text article views including HTML views, PDF and ePub downloads, according to the available data) and Abstracts Views on Vision4Press platform.
Data correspond to usage on the plateform after 2015. The current usage metrics is available 48-96 hours after online publication and is updated daily on week days.
Initial download of the metrics may take a while.