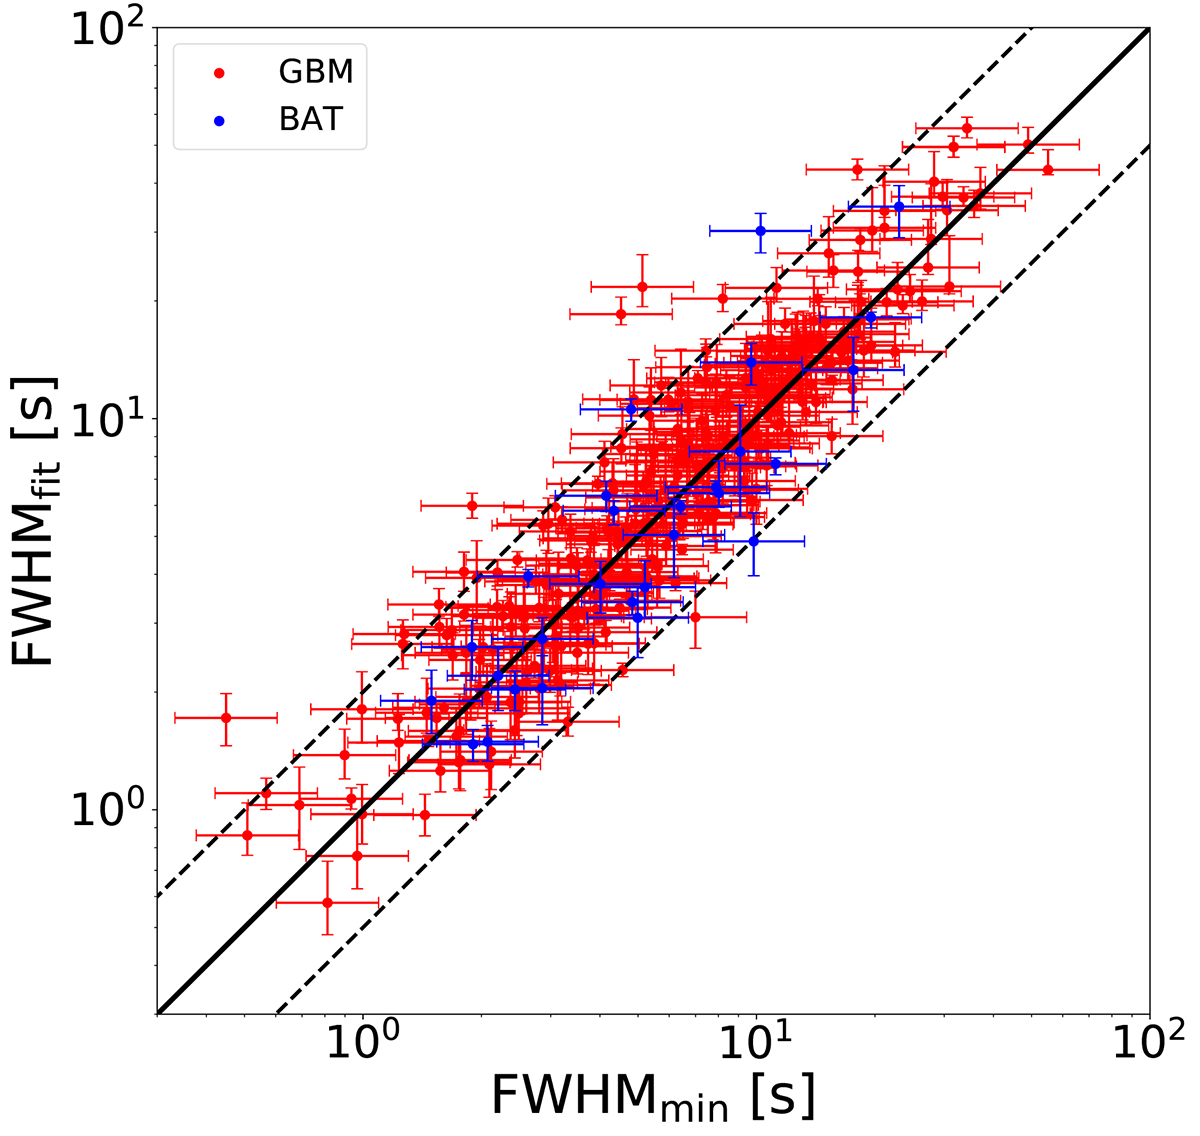
Fig. A.1.
Download original image
Plot presenting FWHMmin computed either by following the method described in C23, or by directly fitting the narrowest pulse by a Norris function (called here FWHMfit). Red (blue) points were obtained using GBM (resp. BAT) data. The black line indicates the equality line while the dashed lines show a factor 2 of discrepancy, illustrating that most measurements fall within this range.
Current usage metrics show cumulative count of Article Views (full-text article views including HTML views, PDF and ePub downloads, according to the available data) and Abstracts Views on Vision4Press platform.
Data correspond to usage on the plateform after 2015. The current usage metrics is available 48-96 hours after online publication and is updated daily on week days.
Initial download of the metrics may take a while.