Fig. 5.
Download original image
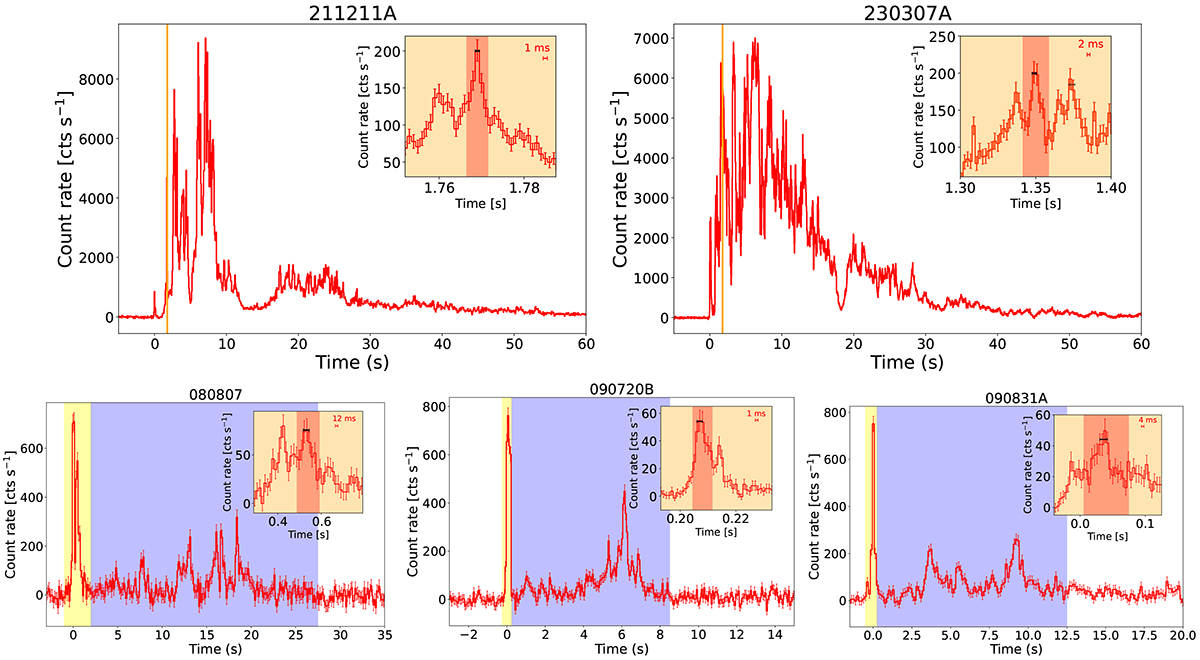
Top panels: LC of 211211A (left) and of 230307A (right) when using the 8–1000 keV range. Bottom panels, left to right: LC of 080807, 090720B, and 090832A, respectively (in the same energy range as top panels). The yellow window includes the initial short spike, while the blue one includes the extended emission. The inset in each panel shows a zoom-in on the narrowest pulse. The black point indicates the detection timescale, Δtdet, of the narrowest pulse, while the orange region shows the window encompassing FWHMmin.
Current usage metrics show cumulative count of Article Views (full-text article views including HTML views, PDF and ePub downloads, according to the available data) and Abstracts Views on Vision4Press platform.
Data correspond to usage on the plateform after 2015. The current usage metrics is available 48-96 hours after online publication and is updated daily on week days.
Initial download of the metrics may take a while.