Fig. 6.
Download original image
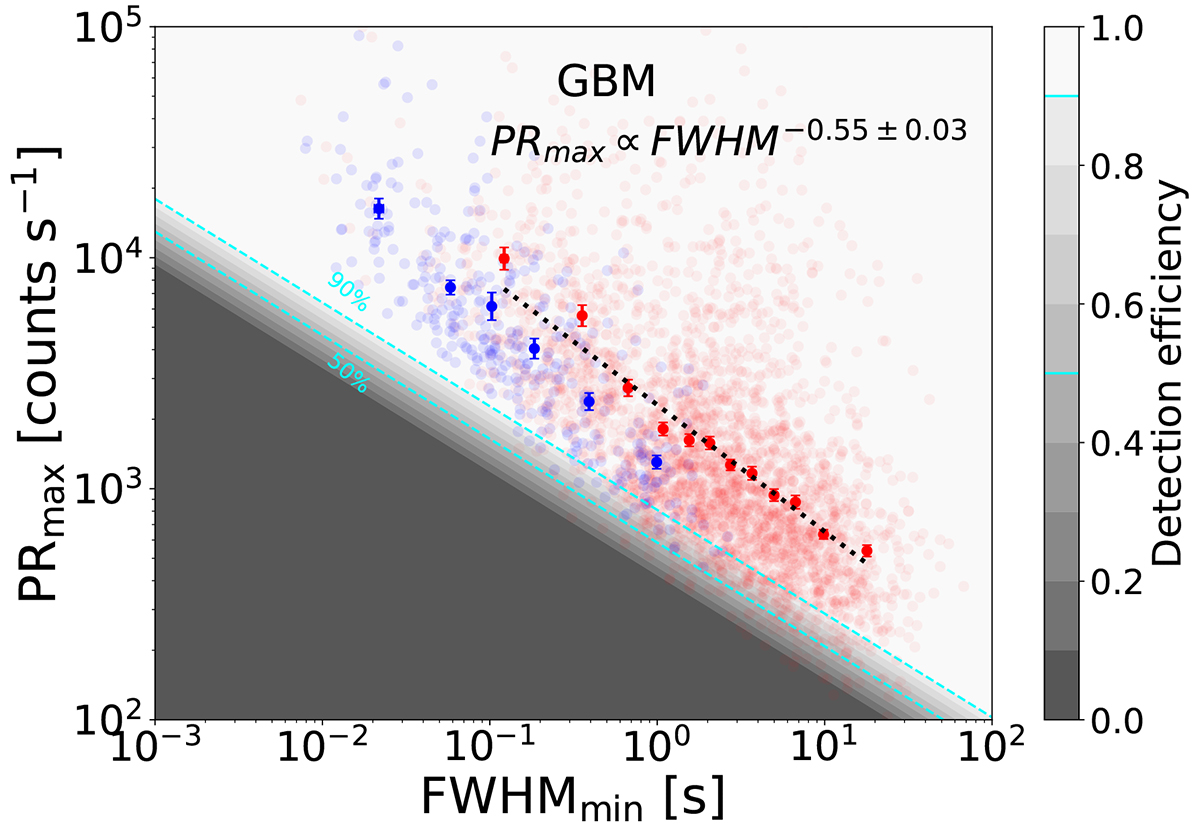
For the GBM sample, PRmax versus FWHMmin. Blue dots represent Type-I GRBs (i.e. SGRBs and SEE-GRBs), while red dots represent Type-II GRBs. Lighter dots correspond to individual GRB data, and darker dots indicate the geometric mean of data from GRB groups sorted by increasing FWHMmin. Each Type-I group consists of 50 GRBs; each Type-II group consists of 270 GRBs. Dotted lines show the best fit for Type-II GRBs. Shaded areas illustrate ten regions with a detection efficiency ranging from 0 to 1. Cyan dashed lines indicate the 50% and 90% detection efficiency contours.
Current usage metrics show cumulative count of Article Views (full-text article views including HTML views, PDF and ePub downloads, according to the available data) and Abstracts Views on Vision4Press platform.
Data correspond to usage on the plateform after 2015. The current usage metrics is available 48-96 hours after online publication and is updated daily on week days.
Initial download of the metrics may take a while.