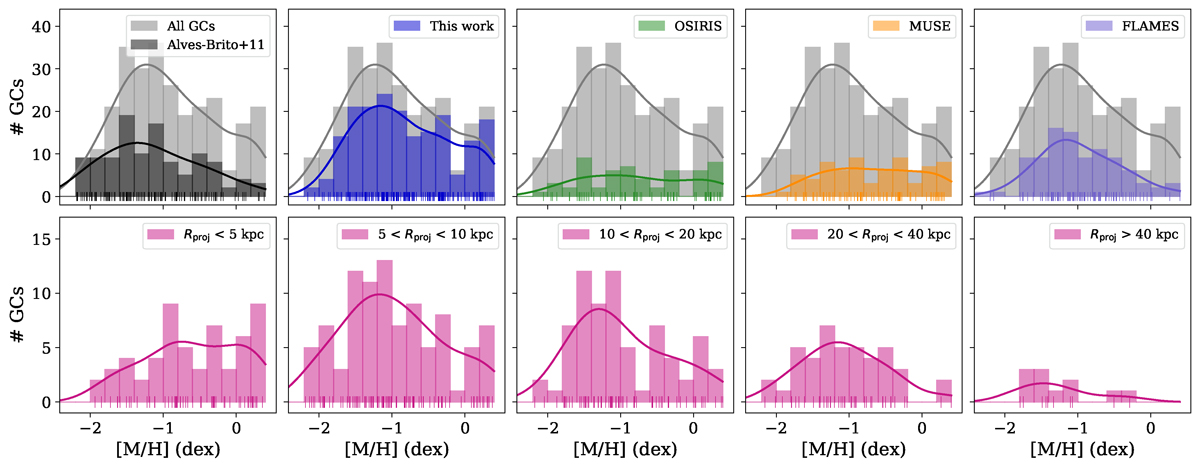
Fig. 10.
Download original image
Distribution of GC metallicities. Top row: Full sample of GC metallicities (shown in grey) combining the measurements from Alves-Brito et al. (2011) (black, first panel) and the ones presented here (blue, second panel). Third to fifth panel: GC metallicities from OSIRIS (green), MUSE (orange), and FLAMES (purple). Bottom: GC metallicities in different radial bins. The lines show kernel density estimations scaled to match the counts. The small vertical lines near zero indicate the individual metallicity measurements.
Current usage metrics show cumulative count of Article Views (full-text article views including HTML views, PDF and ePub downloads, according to the available data) and Abstracts Views on Vision4Press platform.
Data correspond to usage on the plateform after 2015. The current usage metrics is available 48-96 hours after online publication and is updated daily on week days.
Initial download of the metrics may take a while.