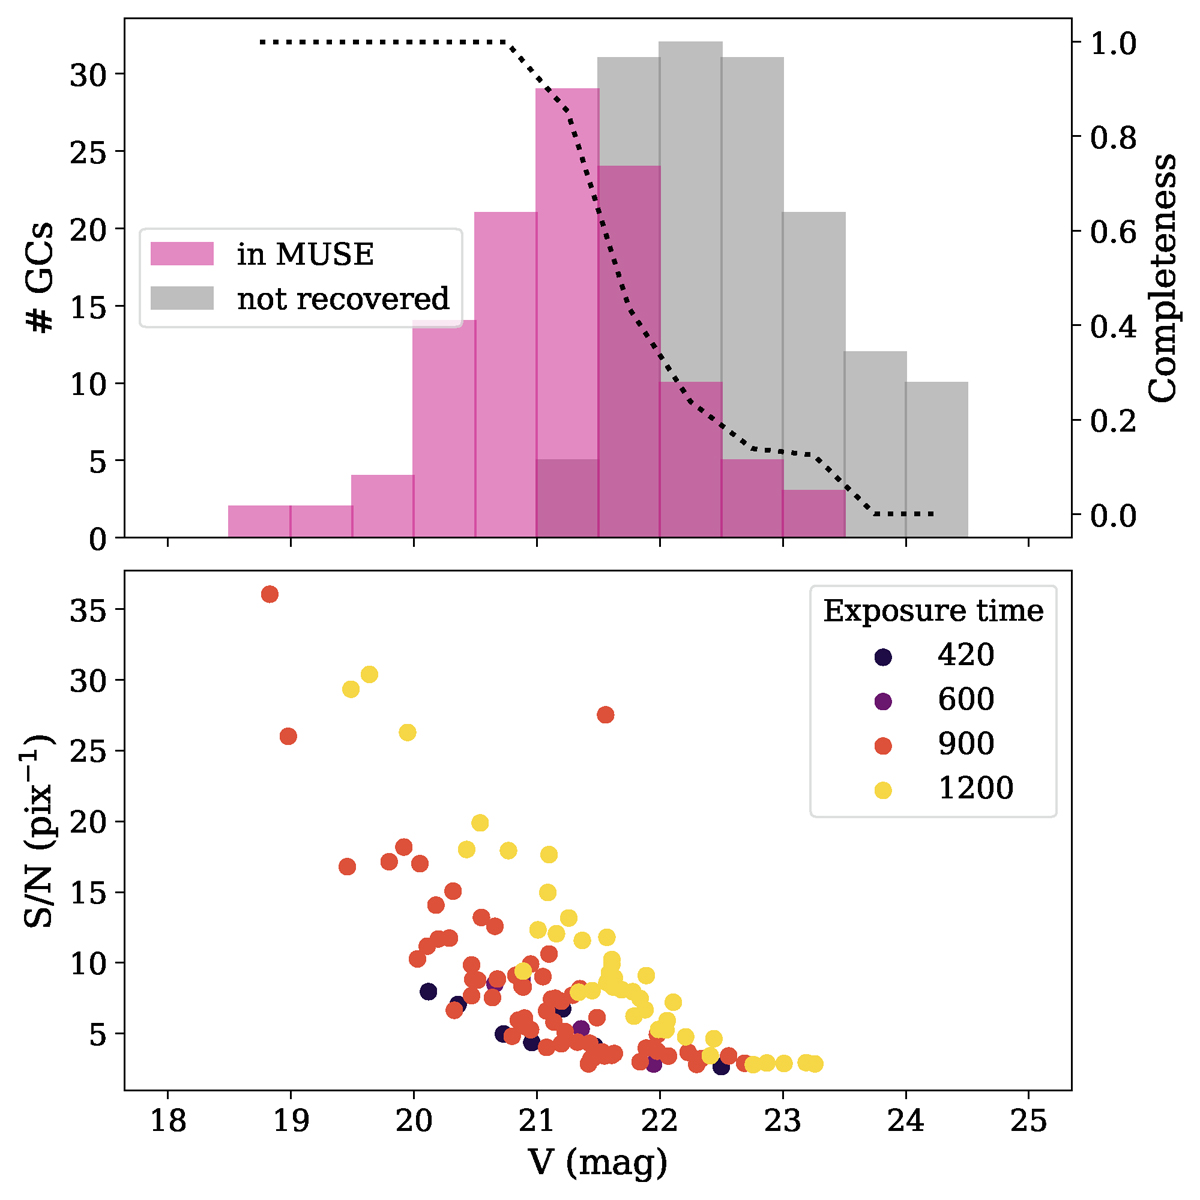
Fig. A.1.
Download original image
Completeness and signal-to-noise of the GCs recovered in the MUSE data. Top: Histogram showing the V-band magnitudes of the GCs in MUSE (pink) that have been cross-matched with the HST ACS catalogue (Spitler et al. 2006; Harris et al. 2010). GCs listed in the HST catalogue that were not recovered in MUSE are shown in the grey histogram. The black dashed line shows the fraction of recovered over all HST ACS GCs as a measure of completeness (right y-axis). Bottom: Signal-to-noise ratio of the MUSE GCs as a function of V-band magnitude. The total exposure time of the corresponding MUSE pointing is shown by the colour.
Current usage metrics show cumulative count of Article Views (full-text article views including HTML views, PDF and ePub downloads, according to the available data) and Abstracts Views on Vision4Press platform.
Data correspond to usage on the plateform after 2015. The current usage metrics is available 48-96 hours after online publication and is updated daily on week days.
Initial download of the metrics may take a while.