Fig. 2.
Download original image
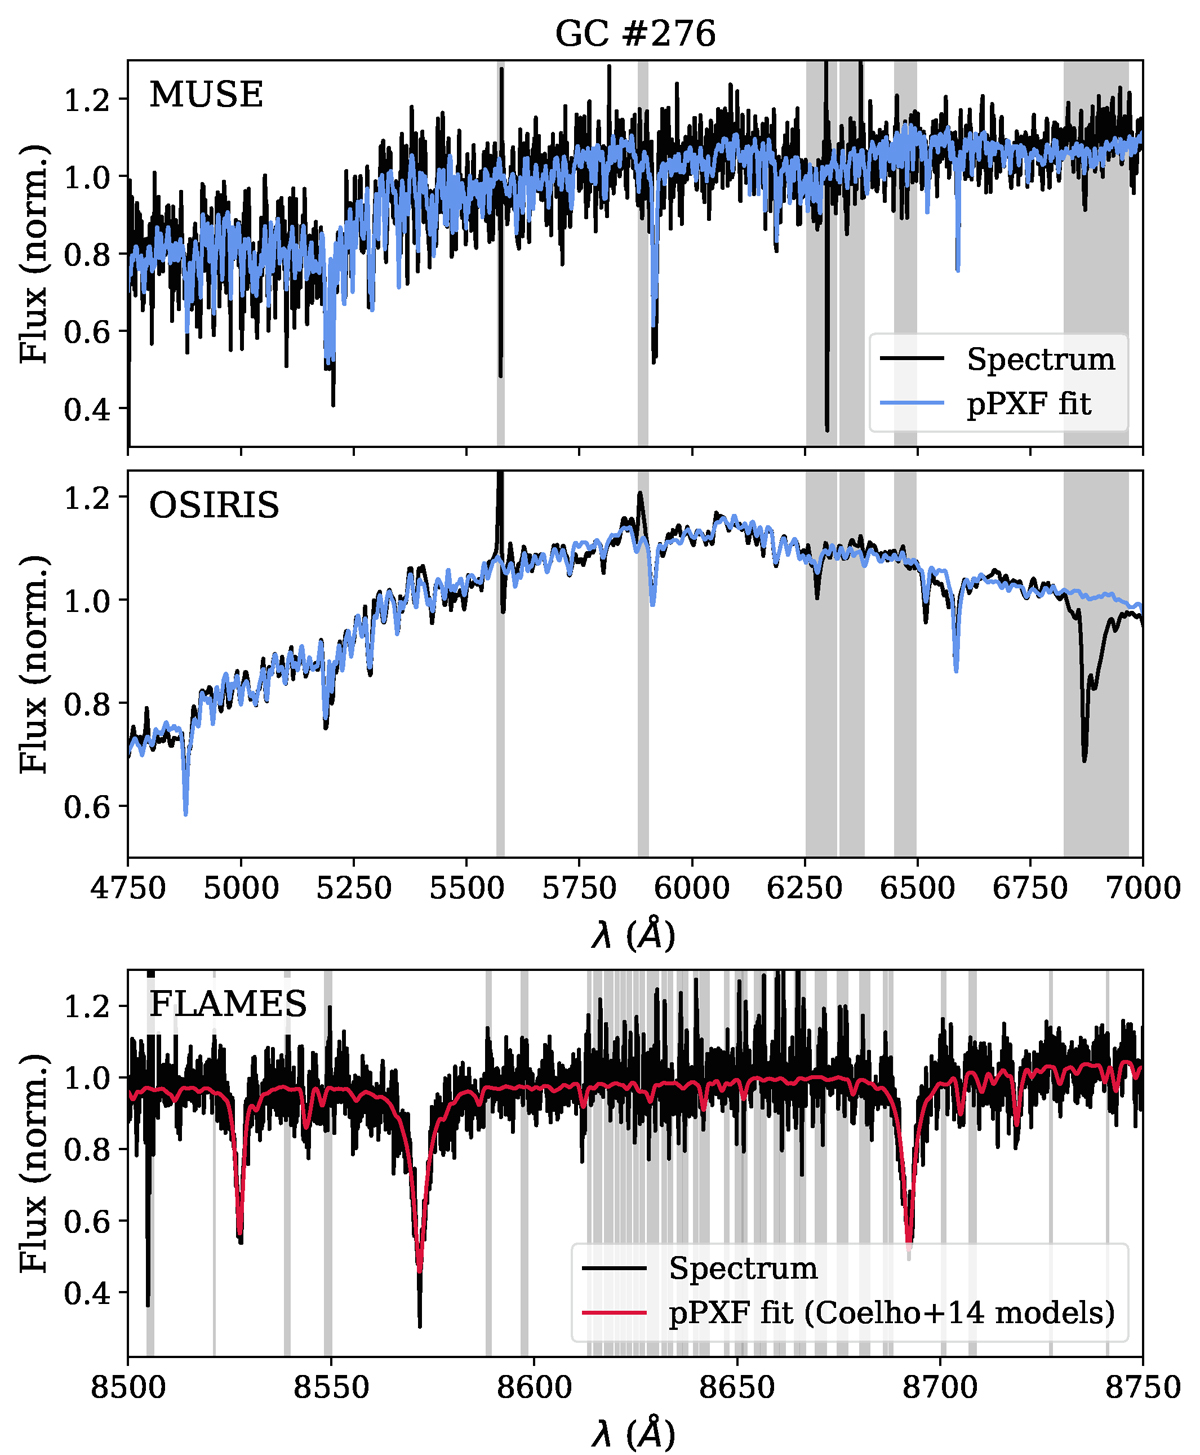
Spectra of GC #276 for which spectra from MUSE (top), OSIRIS (middle), and FLAMES (bottom) are available. The black lines show the data, and the blue and red lines are the fits with PPXF. Shaded regions were excluded due to sky line residuals. The MUSE and OSIRIS spectra were fitted with XSL SSPs, while we used high resolution stellar models from Coelho (2014) to fit the FLAMES spectrum shown here.
Current usage metrics show cumulative count of Article Views (full-text article views including HTML views, PDF and ePub downloads, according to the available data) and Abstracts Views on Vision4Press platform.
Data correspond to usage on the plateform after 2015. The current usage metrics is available 48-96 hours after online publication and is updated daily on week days.
Initial download of the metrics may take a while.