Fig. 4.
Download original image
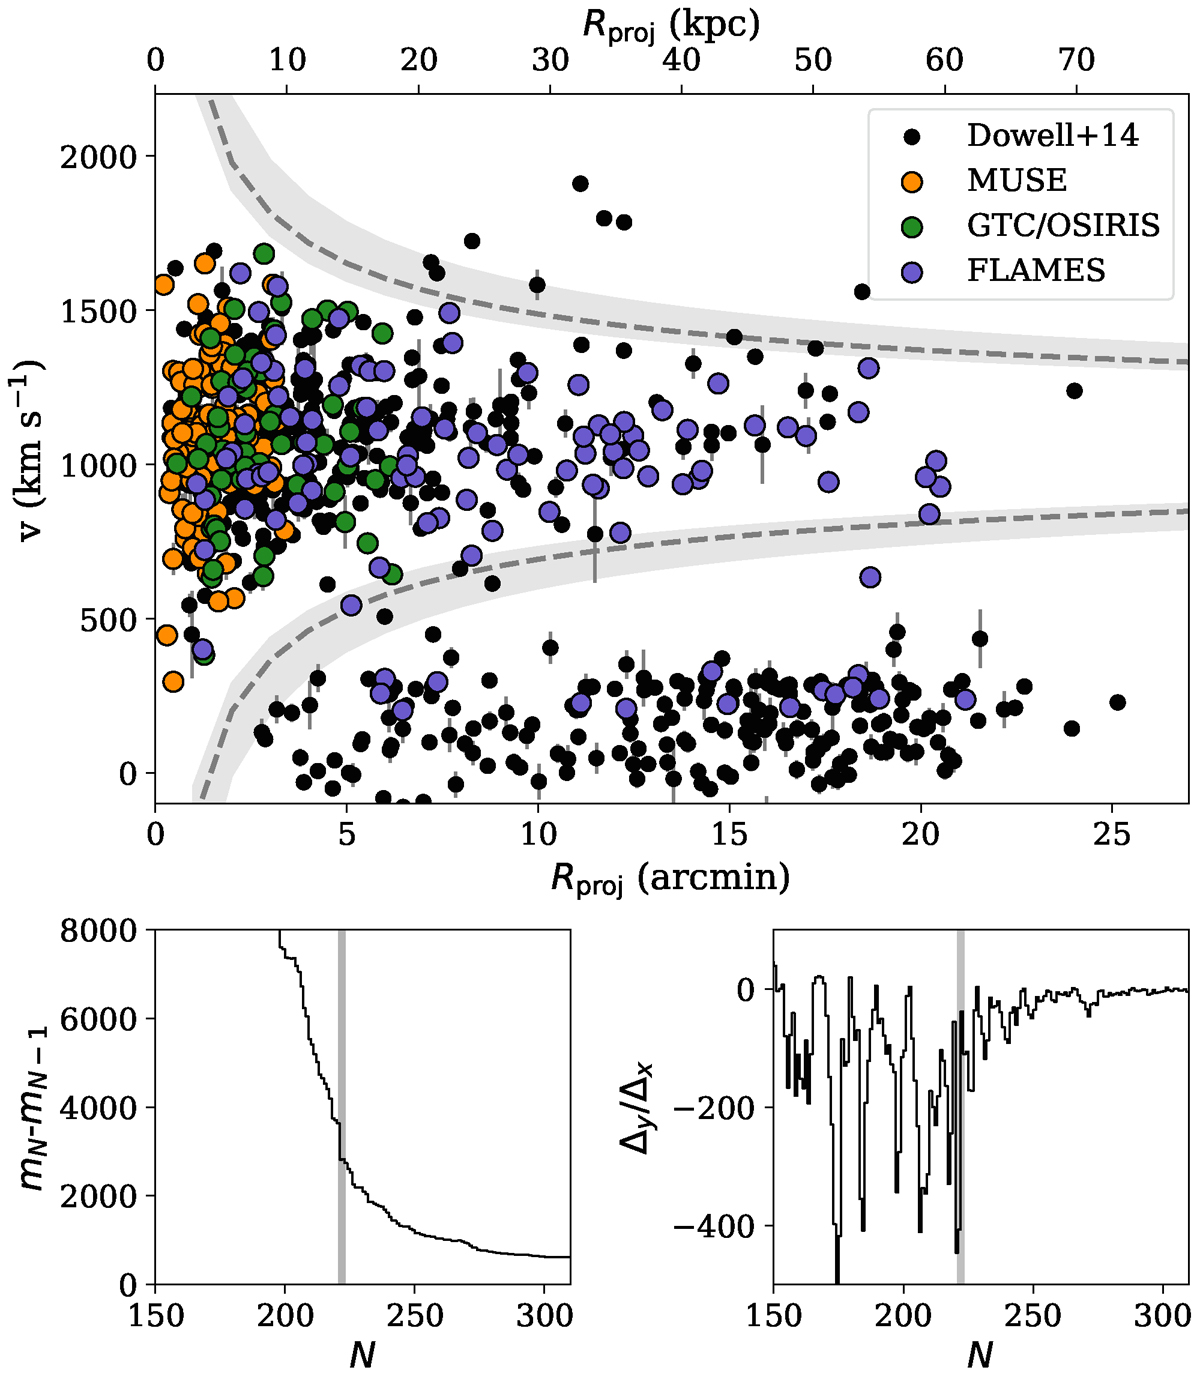
Outlier removal based on GC velocities and projected distances. Top: Line-of-sight velocities as a function of projected galactocentric distance for the full sample of 721 unique sources. Different colours refer to different samples. In case a source is found in multiple samples, only the velocity with the smallest uncertainty is shown. Bottom: Difference between mN and mN − 1 as a function of GC number N (left, see Eq. (1)) and the derivative (right). The vertical grey line indicates our chosen cut-off Ncut = 222, right after the last big jump as seen in the derivative. From this value, the corresponding vmax(R) curve was derived, which is shown as the grey dashed line in the top panel. The shaded regions show the curves when assuming Ncut ± 5.
Current usage metrics show cumulative count of Article Views (full-text article views including HTML views, PDF and ePub downloads, according to the available data) and Abstracts Views on Vision4Press platform.
Data correspond to usage on the plateform after 2015. The current usage metrics is available 48-96 hours after online publication and is updated daily on week days.
Initial download of the metrics may take a while.