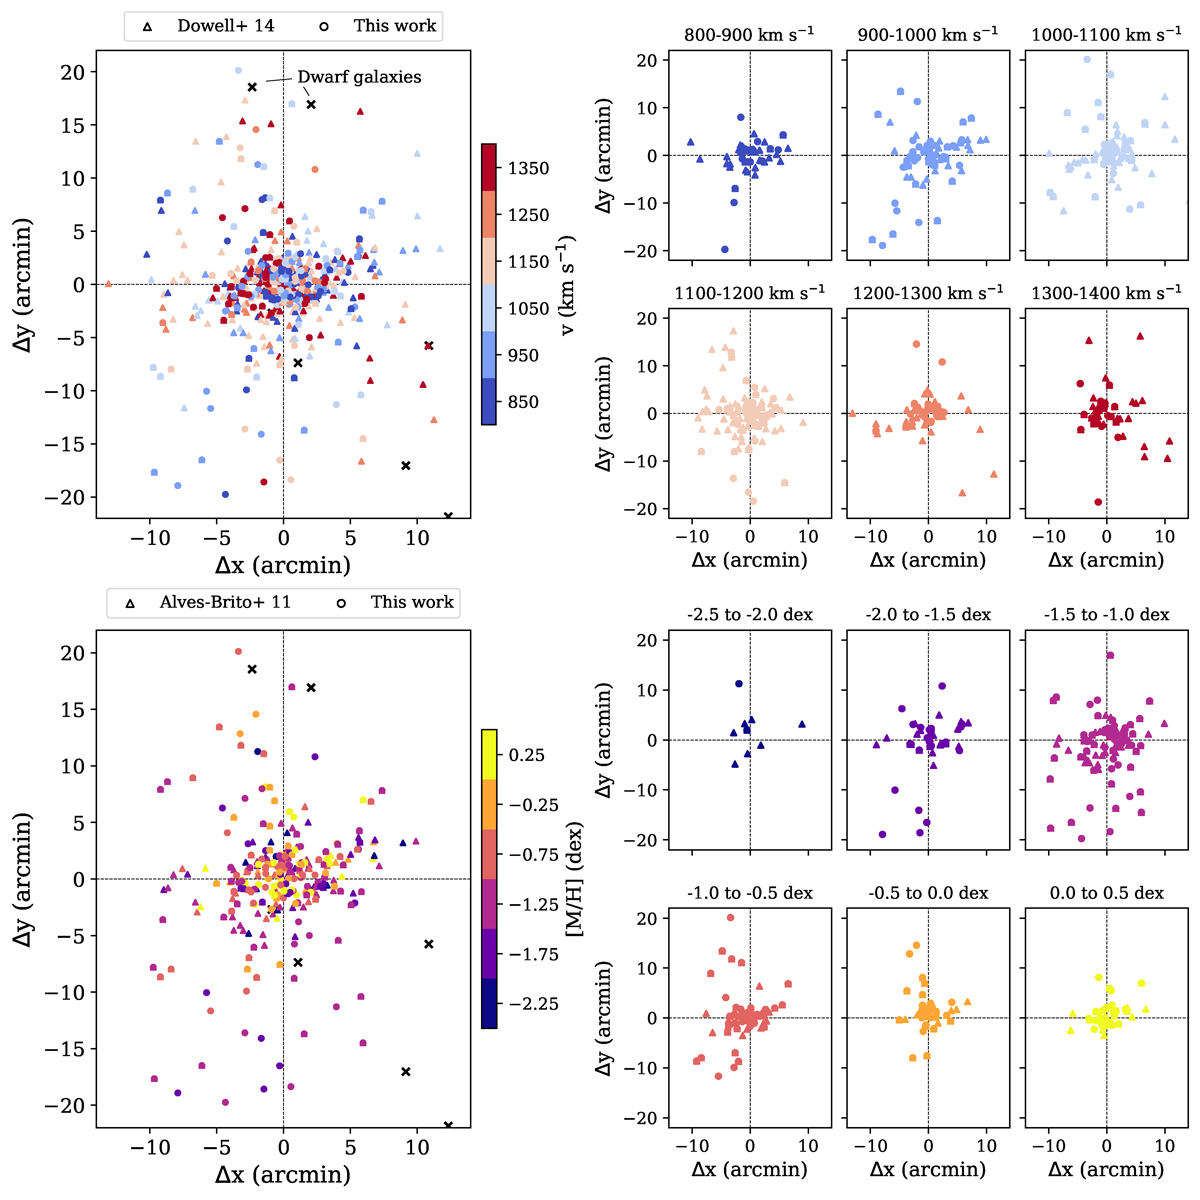
Fig. 5.
Download original image
Spatial distribution of GC velocities (top) and metallicities (bottom). The large panels on the left show the full distribution of velocities and metallicities, respectively. Circles refer to this work; triangles refer to GCs listed in the Dowell et al. (2014) and Alves-Brito et al. (2011). Black crosses show dwarf galaxy candidates near M 104 from Crosby et al. (2024). The smaller panels on the right side show the velocities and metallicities in different bins, as indicated in the panel titles. Fig. B.1 shows a zoom-in of the central 5′ × 5′.
Current usage metrics show cumulative count of Article Views (full-text article views including HTML views, PDF and ePub downloads, according to the available data) and Abstracts Views on Vision4Press platform.
Data correspond to usage on the plateform after 2015. The current usage metrics is available 48-96 hours after online publication and is updated daily on week days.
Initial download of the metrics may take a while.