Open Access
Fig. 6.
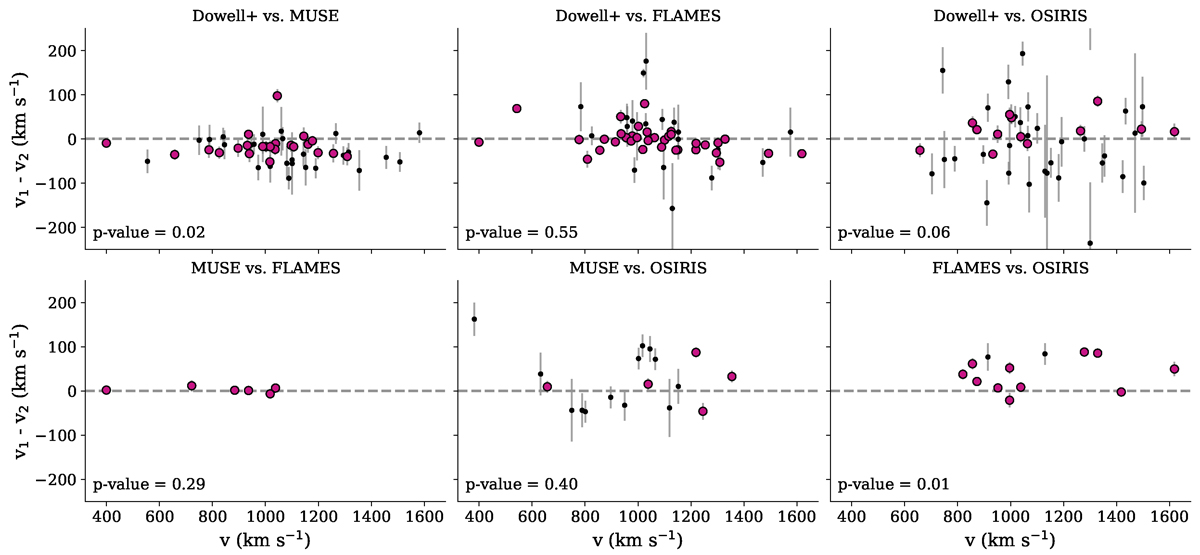
Download original image
Comparison of LOS velocities. Black dots are all the GCs found in both samples as indicated by the titles of the panels. Large pink circles are GCs where the velocity uncertainty in both samples is less than 20 km s−1. In the bottom-left corner, we report the p-value of a paired t-test.
Current usage metrics show cumulative count of Article Views (full-text article views including HTML views, PDF and ePub downloads, according to the available data) and Abstracts Views on Vision4Press platform.
Data correspond to usage on the plateform after 2015. The current usage metrics is available 48-96 hours after online publication and is updated daily on week days.
Initial download of the metrics may take a while.