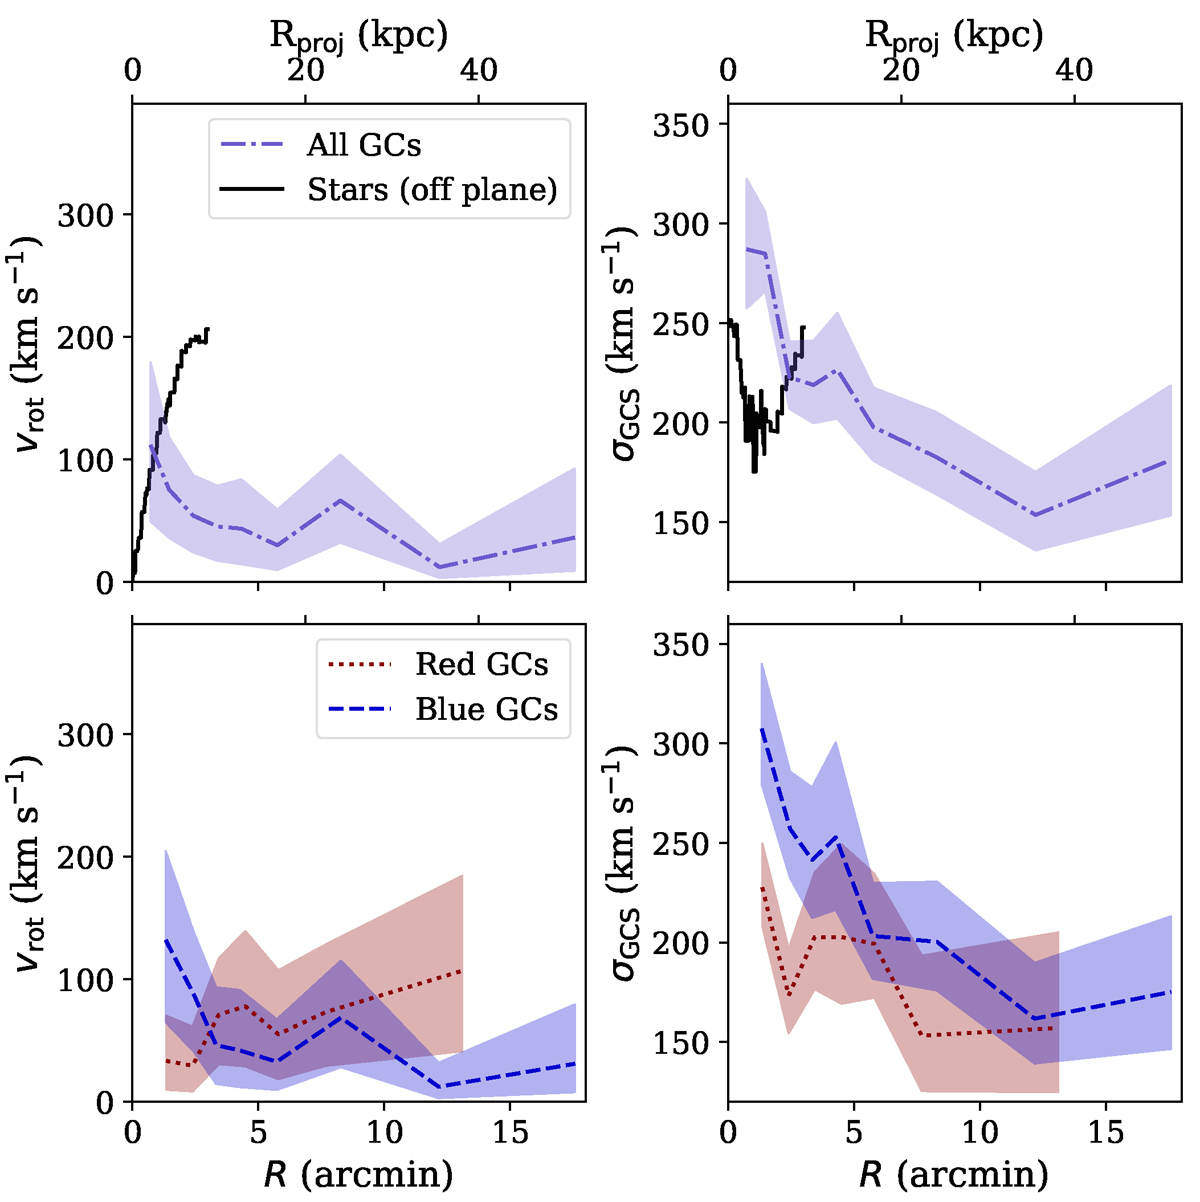
Fig. 8.
Download original image
Results of the simple kinematic model as a function of radius. Top left: GC system rotation amplitude vrot for all GCs in purple. The black line shows the LOS velocities of the stellar component, taken along a slit 0.4′ above the plane of the disc. Top right: Velocity dispersion of the full GC sample σGCS in purple. Within the rotation-dominated disc, the dispersion is significantly lower than off-plane. Bottom panels: GC rotation amplitude and dispersion for the red and blue GC subpopulations, separately.
Current usage metrics show cumulative count of Article Views (full-text article views including HTML views, PDF and ePub downloads, according to the available data) and Abstracts Views on Vision4Press platform.
Data correspond to usage on the plateform after 2015. The current usage metrics is available 48-96 hours after online publication and is updated daily on week days.
Initial download of the metrics may take a while.