Fig. 9.
Download original image
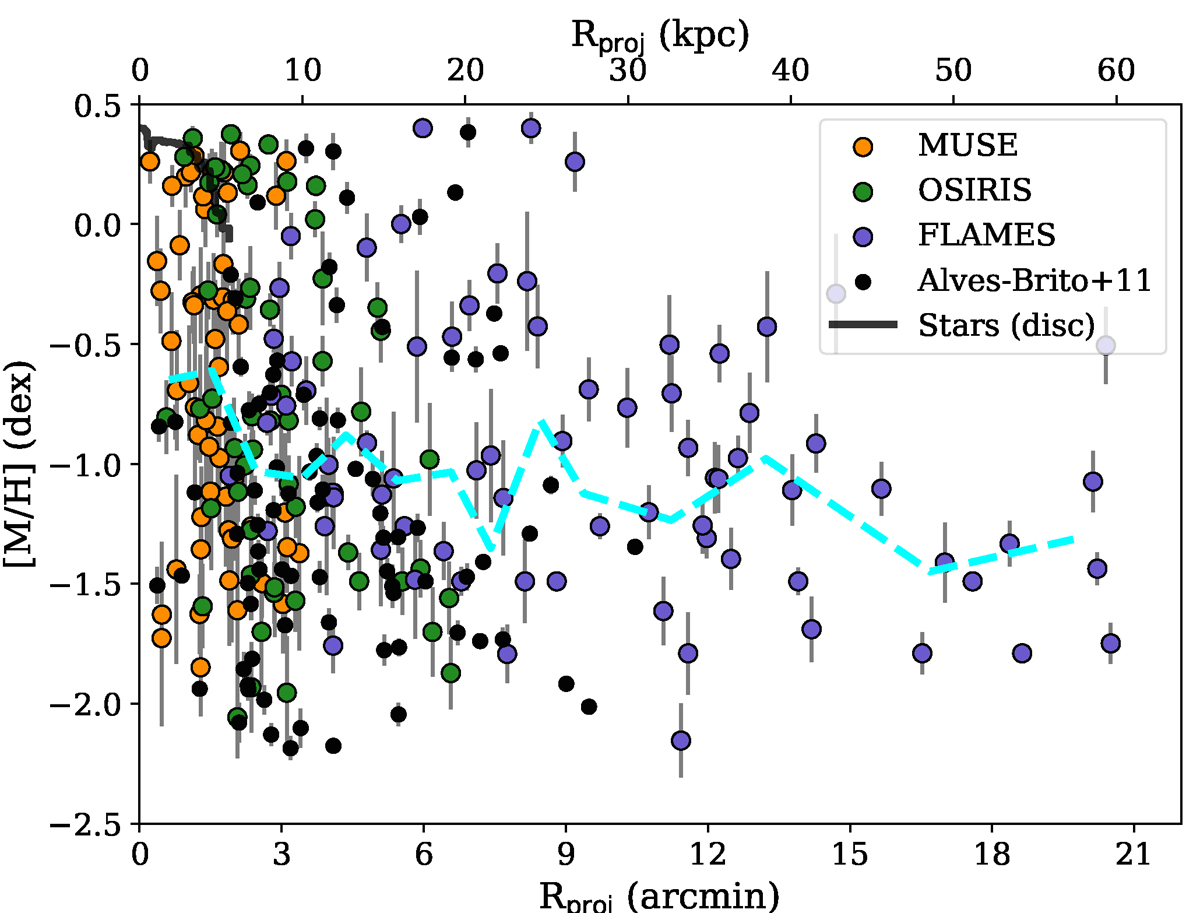
Globular cluster metallicities as a function of galactocentric distance. Different coloured dots indicate metallicities from different instruments. Smaller back dots refer to metallicities from Alves-Brito et al. (2011). In case multiple metallicities are available, preference is given to OSIRIS over MUSE over FLAMES. The cyan dashed line shows the mean metallicity profile. The black line shows the metallicity of the stellar disc.
Current usage metrics show cumulative count of Article Views (full-text article views including HTML views, PDF and ePub downloads, according to the available data) and Abstracts Views on Vision4Press platform.
Data correspond to usage on the plateform after 2015. The current usage metrics is available 48-96 hours after online publication and is updated daily on week days.
Initial download of the metrics may take a while.