Fig. 4.
Download original image
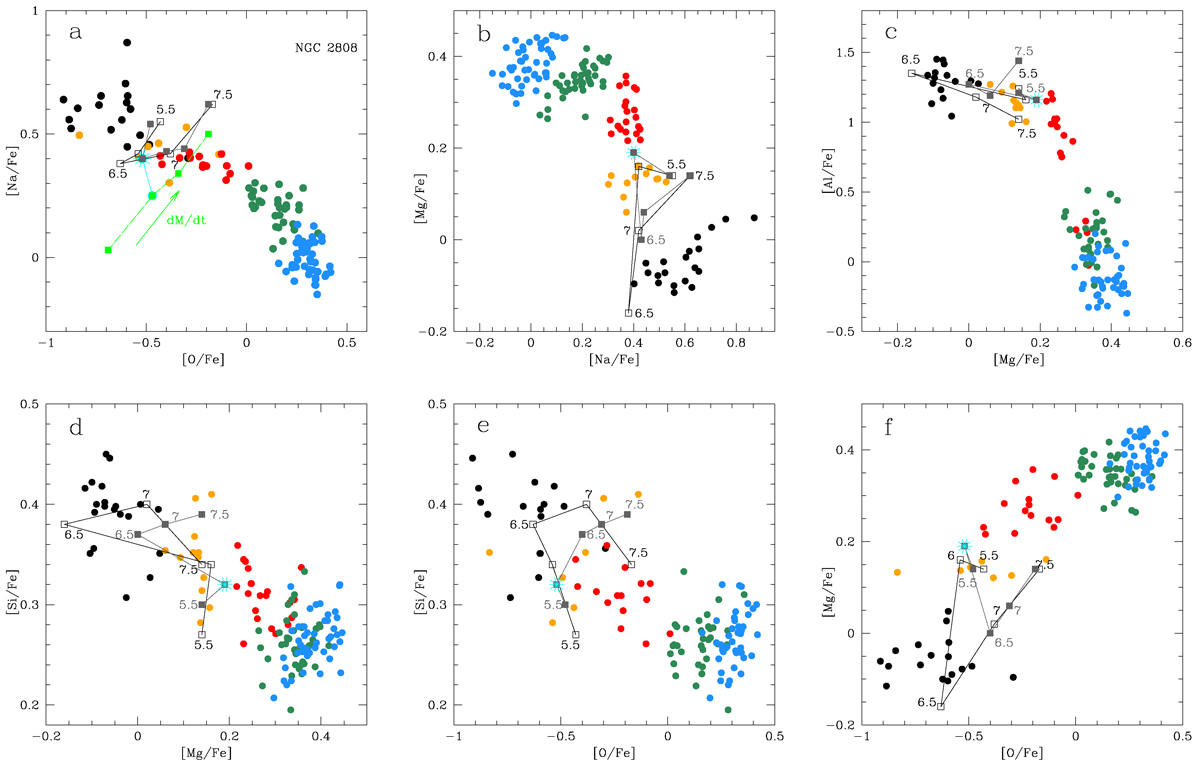
Same as Fig. 3, showing different model outputs. GREY: The squares represents the 5.5, 6.5, 7, and 7.5 M⊙ location for the new standard η 0.25Ne2; BLACK: (Open black squares) models η 0.25Ne2 for 5.5, 6, 6.5, and 7 M⊙, for models that have δ[Fe/H] = –0.1. The big cyan stars define the location of the new standard, η 0.25Ne2, 6 M⊙. In panel a, the green squares are the 6 M⊙ ejecta for mass-loss rates with Reimers’ parameter η going from η = 0.001 (0.1 standard) to η = 0.02 (old standard), also shown in Fig. 3.
Current usage metrics show cumulative count of Article Views (full-text article views including HTML views, PDF and ePub downloads, according to the available data) and Abstracts Views on Vision4Press platform.
Data correspond to usage on the plateform after 2015. The current usage metrics is available 48-96 hours after online publication and is updated daily on week days.
Initial download of the metrics may take a while.