Open Access
Fig. 1.
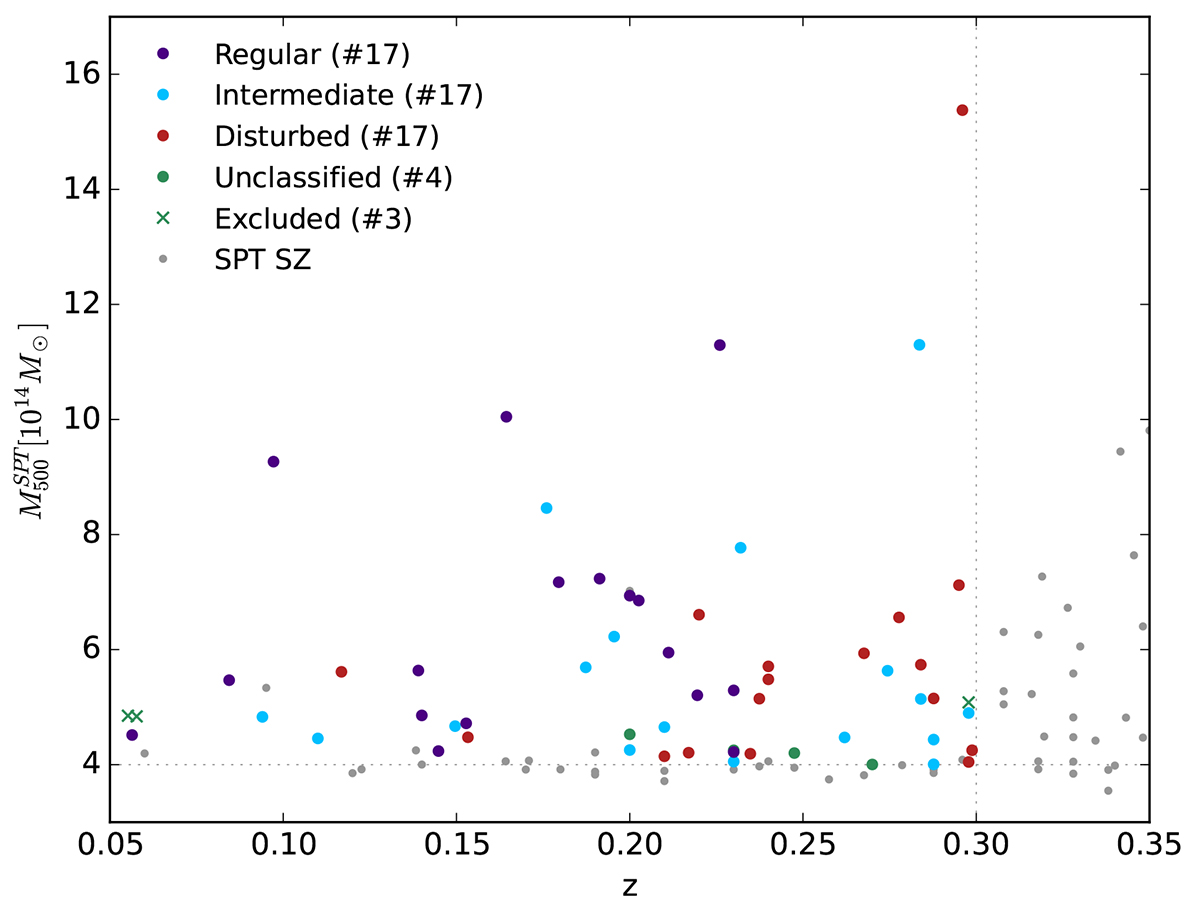
Download original image
Studied sample (colored points) and entire SPT catalog (gray points, Bocquet et al. 2019). Gray points within the redshift-mass selection area did not meet the S/N or footprint constraints. Crosses indicate galaxy clusters that were subsequently removed from our sample.
Current usage metrics show cumulative count of Article Views (full-text article views including HTML views, PDF and ePub downloads, according to the available data) and Abstracts Views on Vision4Press platform.
Data correspond to usage on the plateform after 2015. The current usage metrics is available 48-96 hours after online publication and is updated daily on week days.
Initial download of the metrics may take a while.