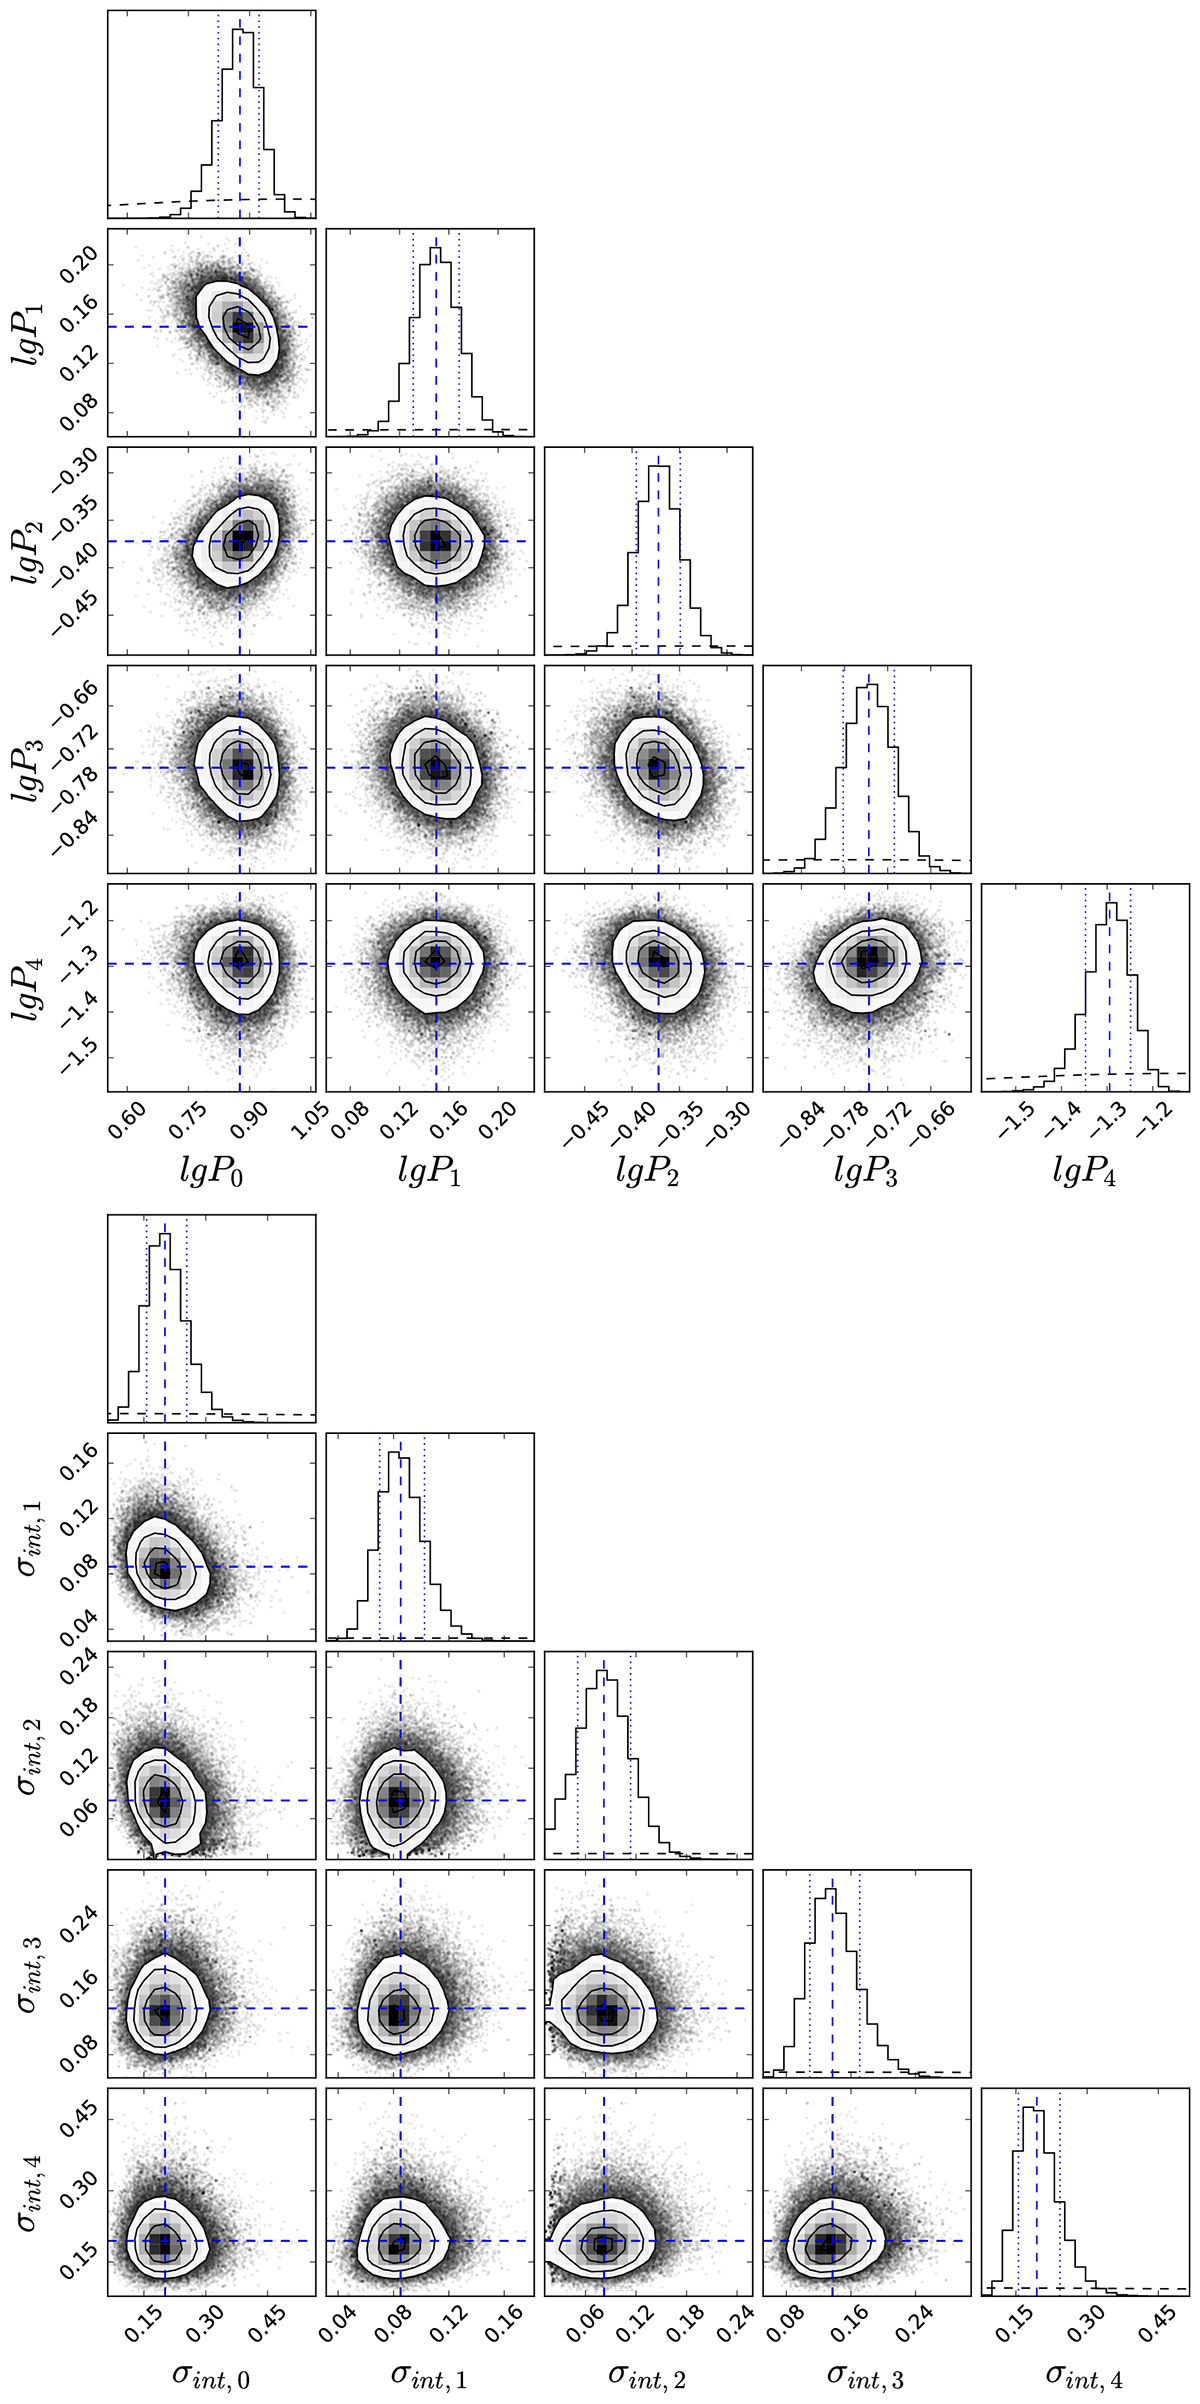
Fig. 10.
Download original image
Joint and marginal posterior distributions for the population-averaged pressure parameters lgPk (top panel) and intrinsic scatters σint, k (bottom panel) at the five radii (interpolation knots). Dashed blue lines represent the median values. In the diagonal panels, vertical dotted blue lines indicate the 68% uncertainty interval, while dashed black lines represent the adopted prior. All parameters show little correlation, due to our choice of the radial profile modelization and the knots spacing. Prior distributions have a negligible impact on the posterior distributions.
Current usage metrics show cumulative count of Article Views (full-text article views including HTML views, PDF and ePub downloads, according to the available data) and Abstracts Views on Vision4Press platform.
Data correspond to usage on the plateform after 2015. The current usage metrics is available 48-96 hours after online publication and is updated daily on week days.
Initial download of the metrics may take a while.