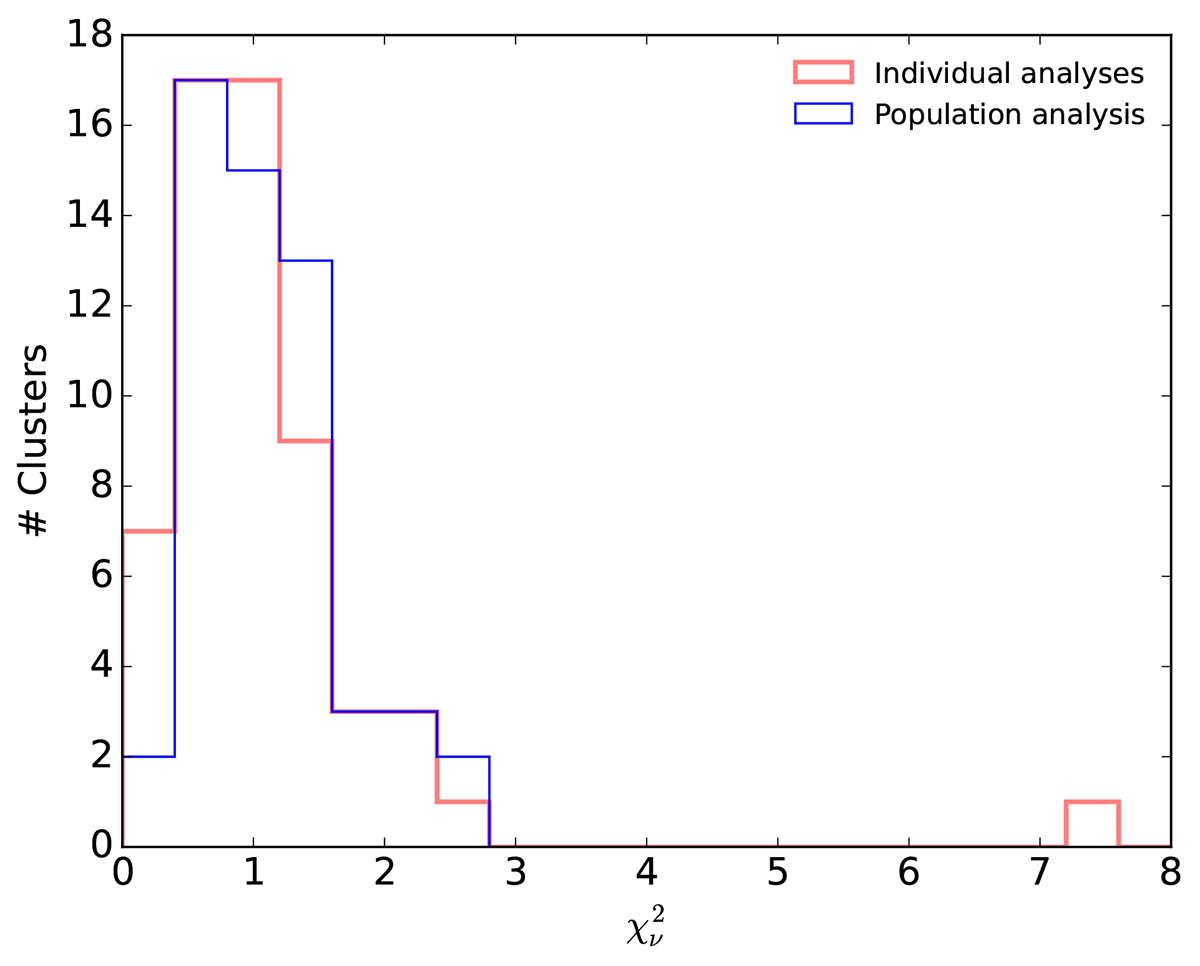
Fig. 4.
Download original image
Distribution of the reduced chi-square χν = 92 of the 58 individual fits and the population fit of 55 clusters. The red outlier with χν2 > 7 is SPT-CLJ0405-4916, which is characterized by a highly oscillating surface brightness distribution in its outermost region, while our background model, the pedestal, is a constant. For this reason, we excluded it from the population analysis.
Current usage metrics show cumulative count of Article Views (full-text article views including HTML views, PDF and ePub downloads, according to the available data) and Abstracts Views on Vision4Press platform.
Data correspond to usage on the plateform after 2015. The current usage metrics is available 48-96 hours after online publication and is updated daily on week days.
Initial download of the metrics may take a while.