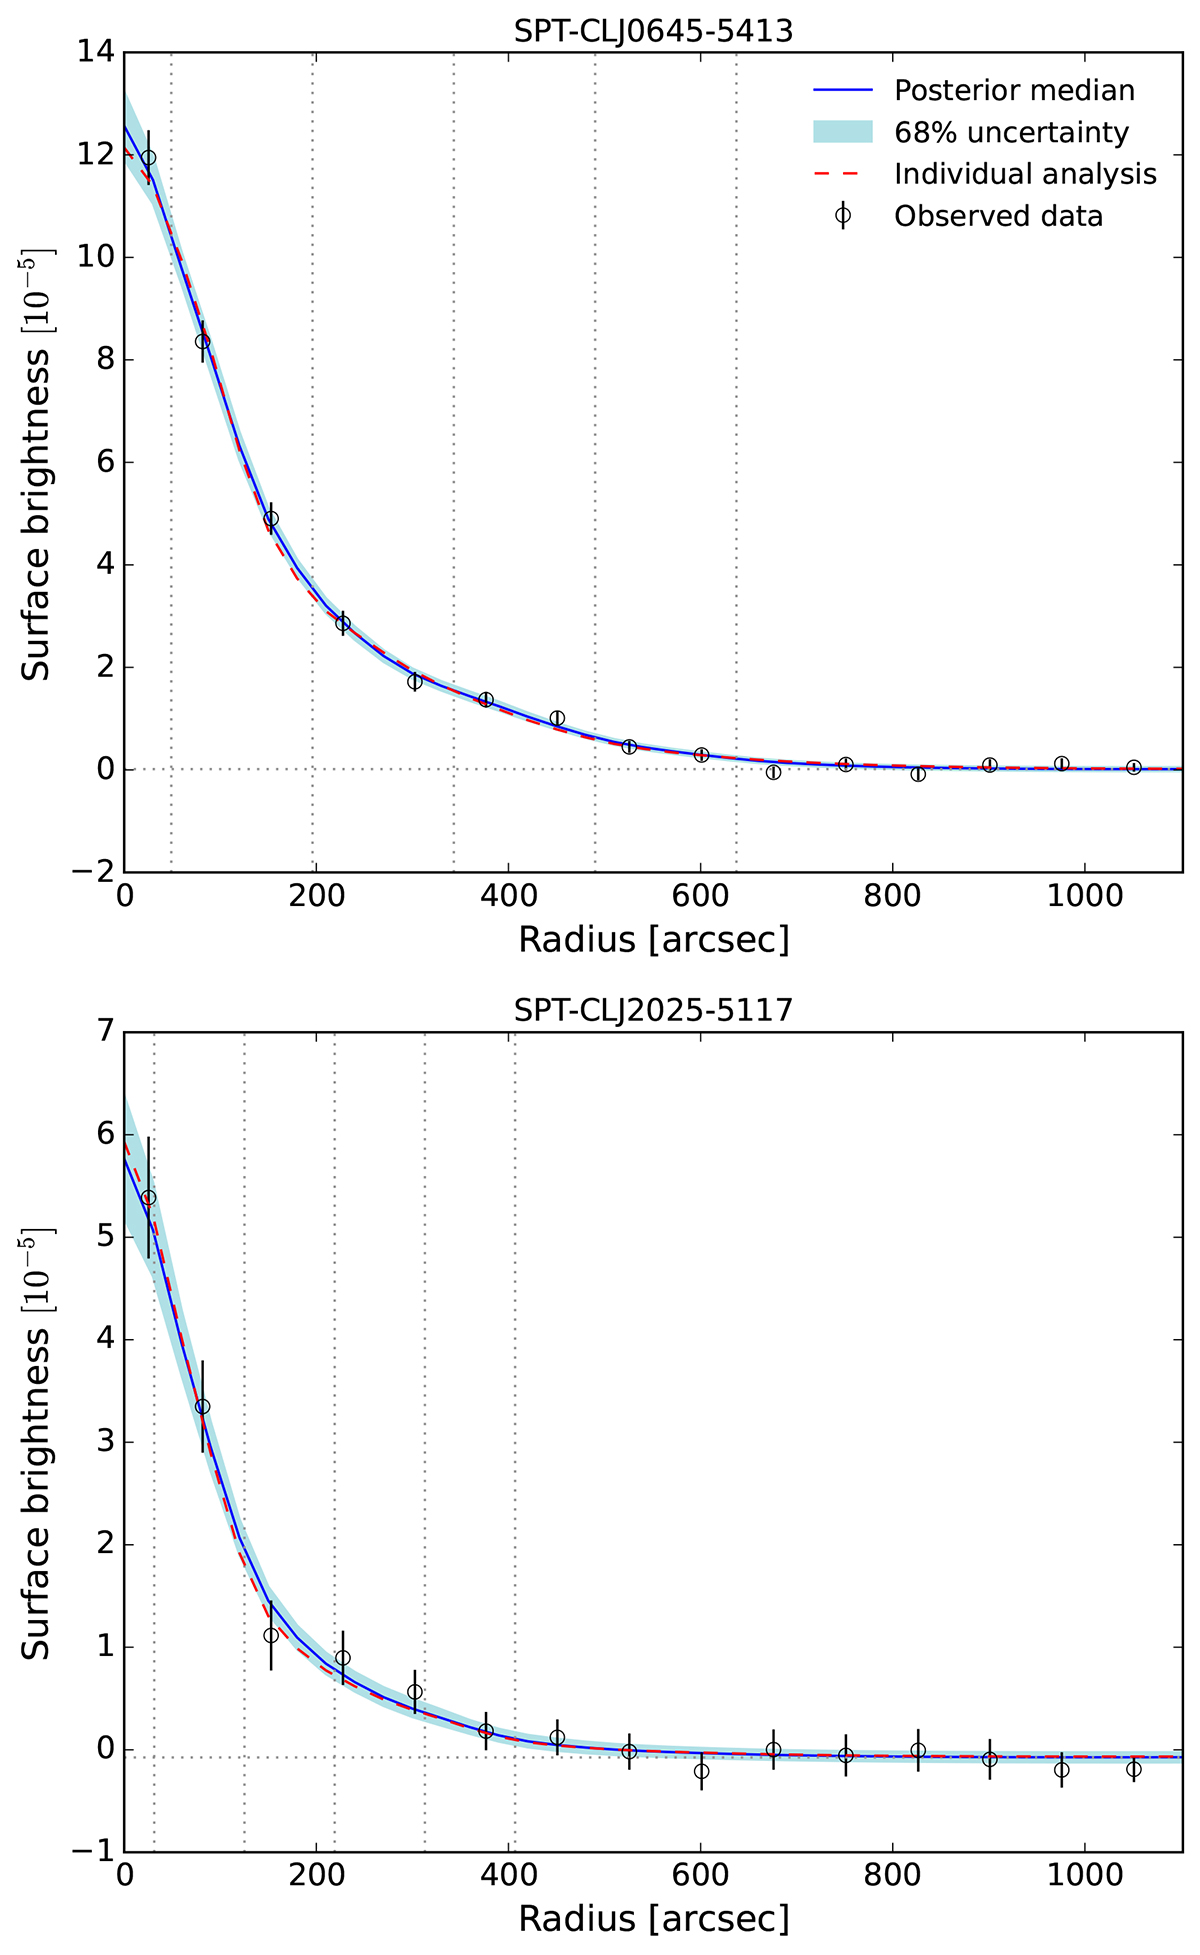
Fig. 8.
Download original image
Surface brightness profiles of two clusters, taken from the population analysis. Vertical dotted gray lines show the placement of the knots, whereas the horizontal one indicates the estimated pedestal level. The plots highlight that our radial profile parametrization is adequate for these two clusters. Figure 4 quantifies the fit for the entire sample.
Current usage metrics show cumulative count of Article Views (full-text article views including HTML views, PDF and ePub downloads, according to the available data) and Abstracts Views on Vision4Press platform.
Data correspond to usage on the plateform after 2015. The current usage metrics is available 48-96 hours after online publication and is updated daily on week days.
Initial download of the metrics may take a while.