Fig. 1
Download original image
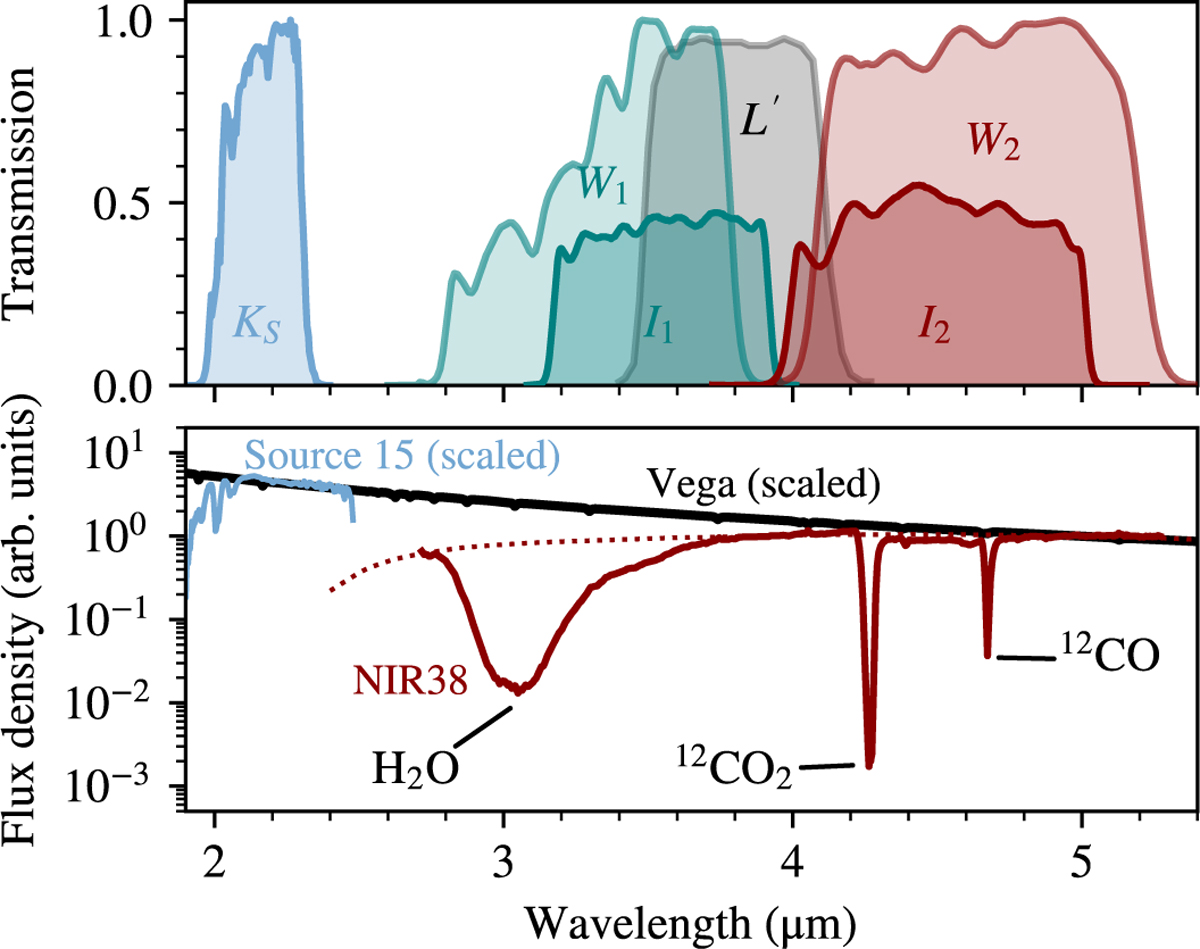
Infrared passbands and SEDs. The upper panel illustrates transmission curves for the infrared passbands KS, W1, I1, L′, I2, and W2. The lower panel presents the SEDs of three distinct sources: the light blue line represents an X-shooter spectrum of source 15 (refer to Table A.2), the solid red line corresponds to the source NIR38, and the black line depicts Vega. All spectra have been rescaled to facilitate a better comparison.
Current usage metrics show cumulative count of Article Views (full-text article views including HTML views, PDF and ePub downloads, according to the available data) and Abstracts Views on Vision4Press platform.
Data correspond to usage on the plateform after 2015. The current usage metrics is available 48-96 hours after online publication and is updated daily on week days.
Initial download of the metrics may take a while.