Fig. A.2
Download original image
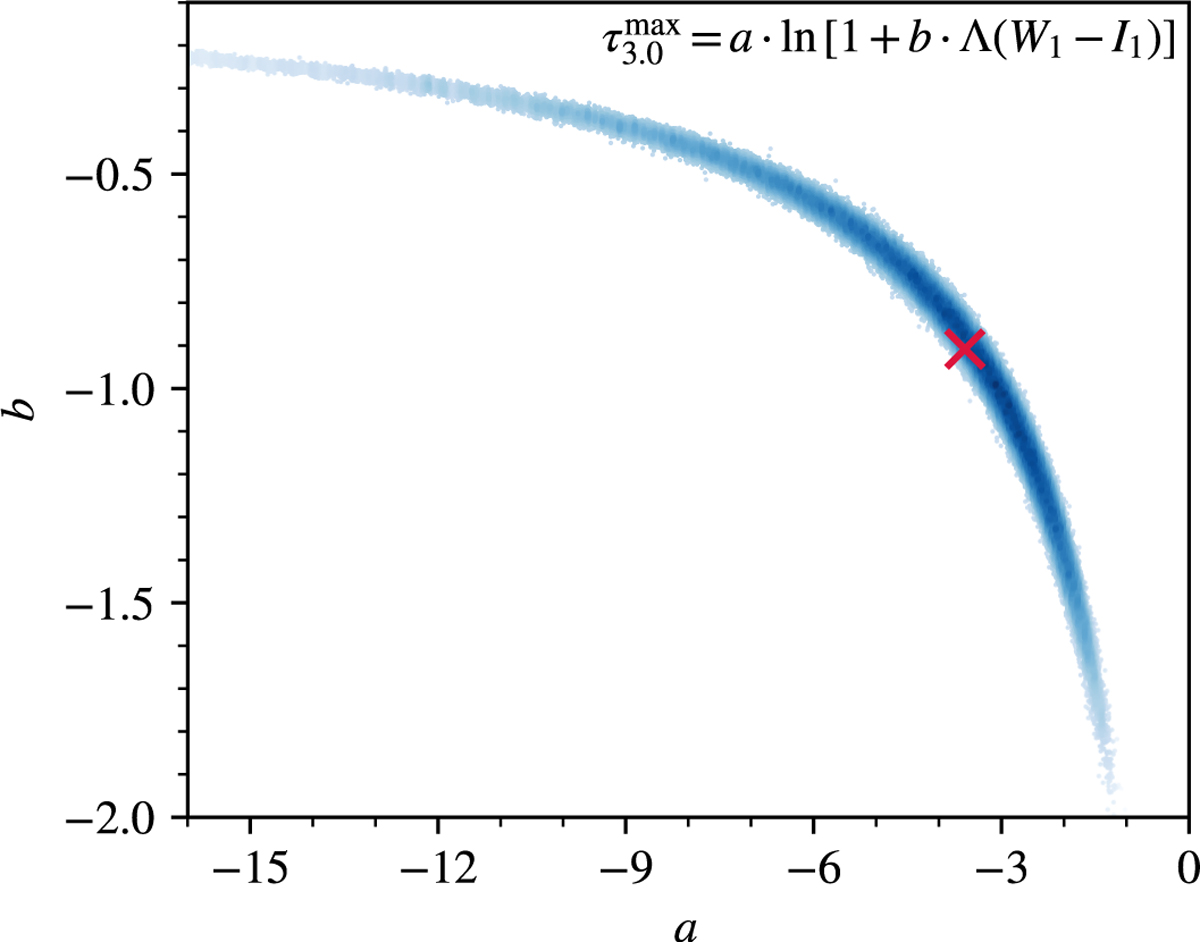
Distribution of best-fit parameters a and b in the empirical calibration of the ice color excess method, specifically Λ(W1 − I1) (see Eq. (16)), based on 105 random fitting realizations. The color scale indicates the density of solutions with darker shades of blue indicating higher density. The geometric median is marked by a red cross and is adopted as the best-fit solution.
Current usage metrics show cumulative count of Article Views (full-text article views including HTML views, PDF and ePub downloads, according to the available data) and Abstracts Views on Vision4Press platform.
Data correspond to usage on the plateform after 2015. The current usage metrics is available 48-96 hours after online publication and is updated daily on week days.
Initial download of the metrics may take a while.