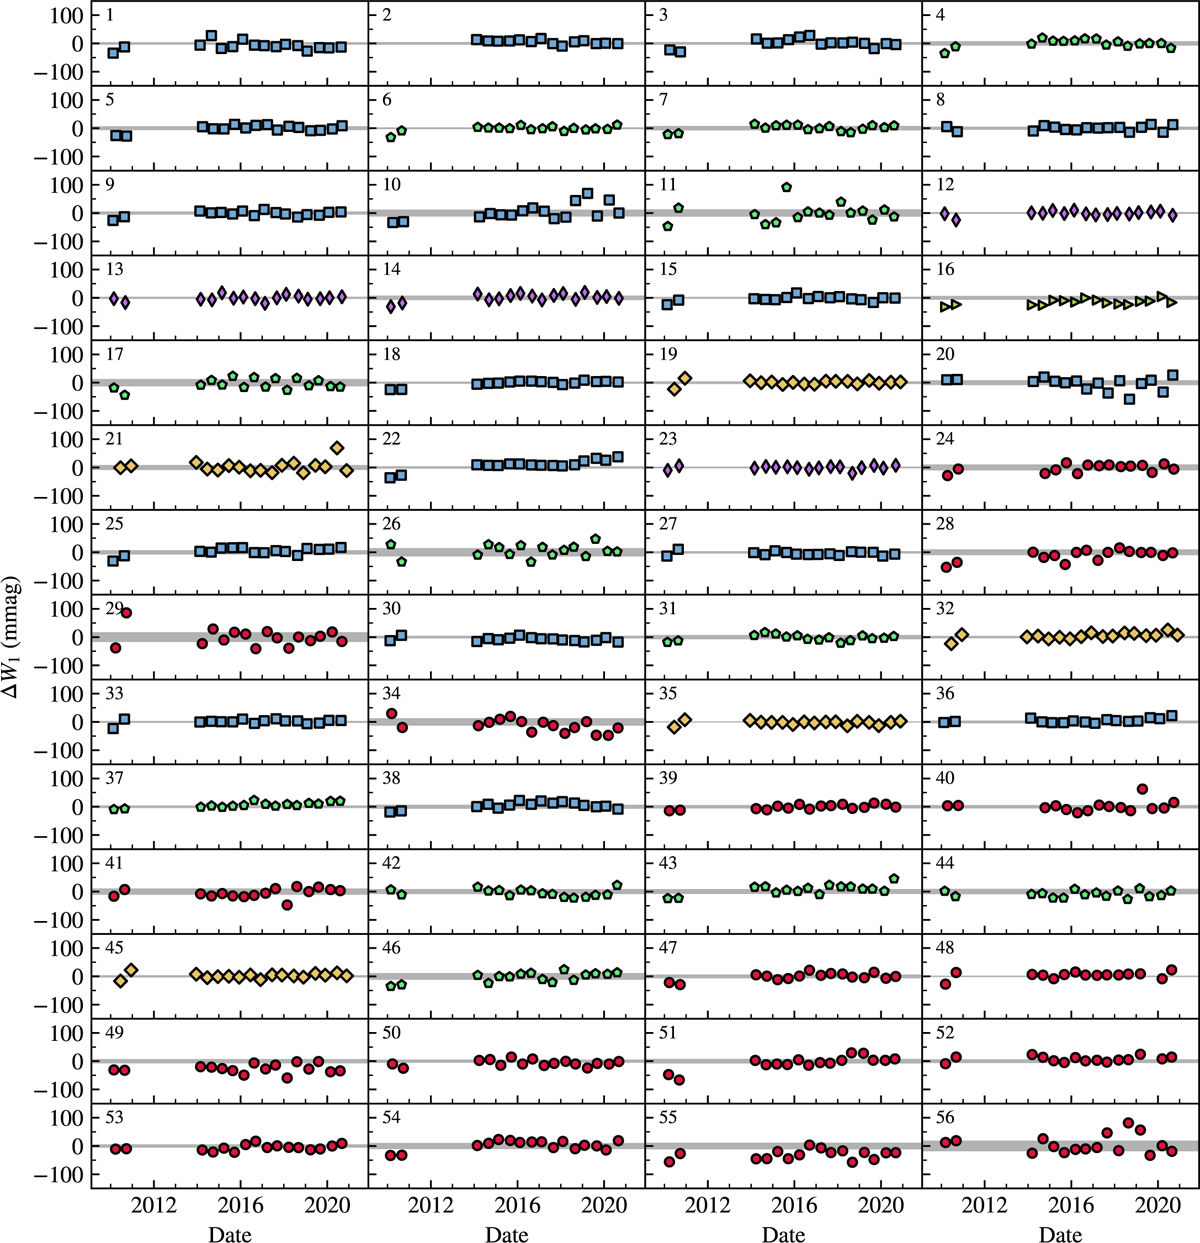
Fig. A.3
Download original image
Time series light curves in the unWISE W1 band for all 56 sources in the calibration sample. Each panel shows the difference between the unTimely and the unWISE mean magnitude in the W1 filter as a function of the observing date, demonstrating the photometric variability over the decade-long baseline. The shaded region indicates the inter-quartile range used for the variability quality cut. The source identification number in the top left of each subplot refers to Table A.2 and the symbol colors and shapes are those listed in Table 1.
Current usage metrics show cumulative count of Article Views (full-text article views including HTML views, PDF and ePub downloads, according to the available data) and Abstracts Views on Vision4Press platform.
Data correspond to usage on the plateform after 2015. The current usage metrics is available 48-96 hours after online publication and is updated daily on week days.
Initial download of the metrics may take a while.