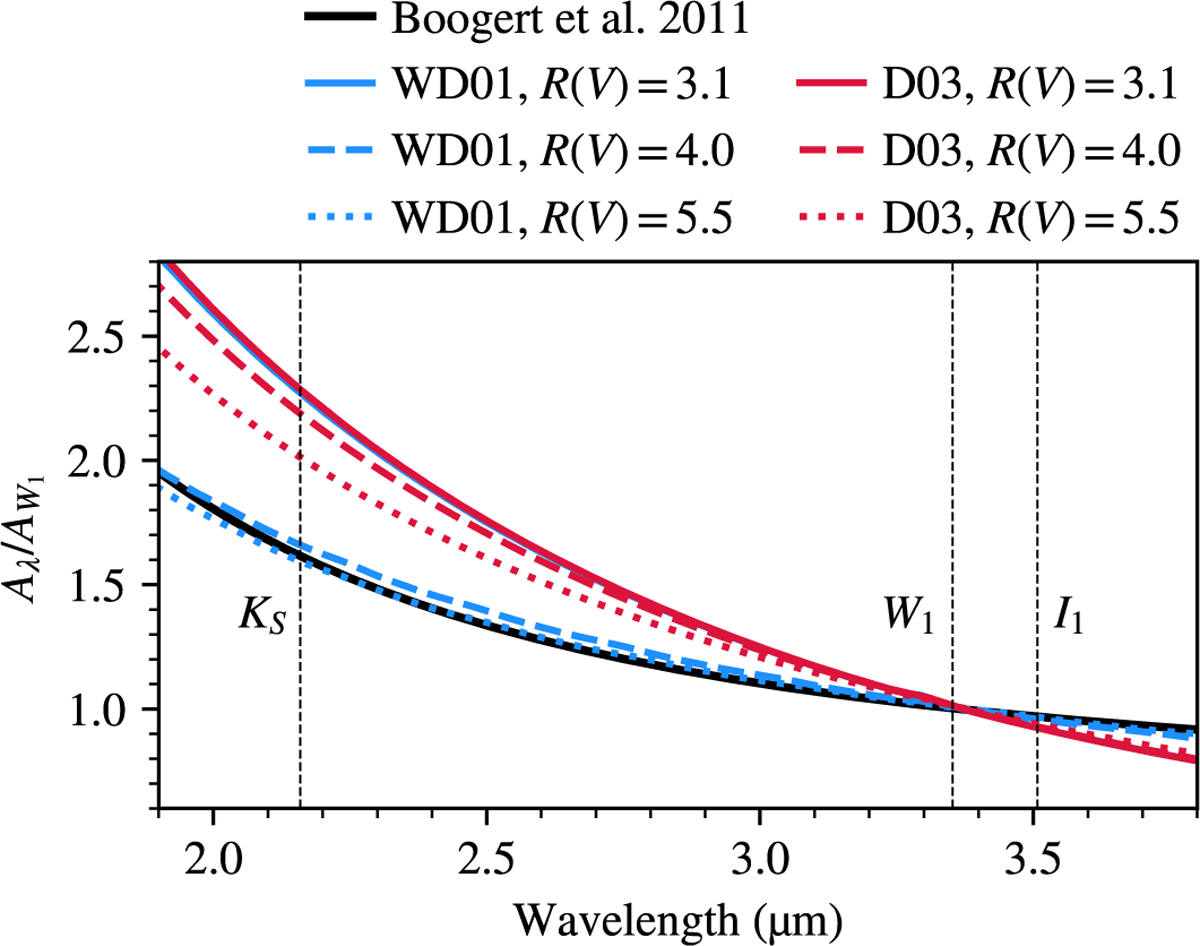
Fig. 2
Download original image
Extinction curves normalized to their value at the effective wavelength of the W1 passband. The different lines correspond to various dust models and R(V) values, as indicated in the legend. WD01 refers to the models of Weingartner & Draine (2001), and D03 to those of Draine (2003). The curves illustrate how both the choice of dust model and R(V) parameter affect the wavelength dependence of extinction.
Current usage metrics show cumulative count of Article Views (full-text article views including HTML views, PDF and ePub downloads, according to the available data) and Abstracts Views on Vision4Press platform.
Data correspond to usage on the plateform after 2015. The current usage metrics is available 48-96 hours after online publication and is updated daily on week days.
Initial download of the metrics may take a while.