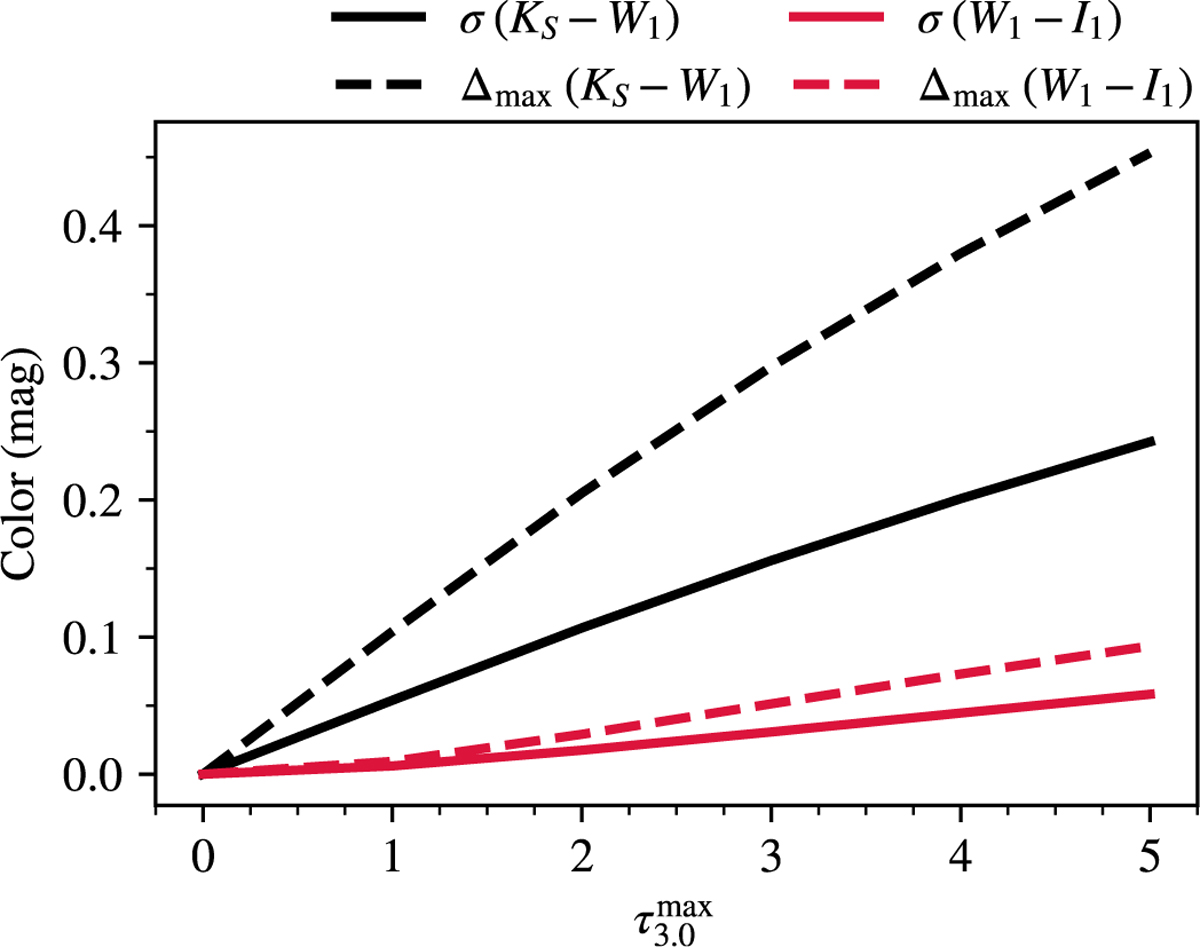
Fig. 5
Download original image
Standard deviation (solid lines) and maximum difference (dashed lines) in KS − W1 (black) and W1 − I1 (red) colors as a function of the peak optical depth of the 3 μm feature, calculated for five absorption profiles (see Fig. 4). The KS − W1 color is significantly more sensitive to variations in the absorption profile, while W1 − I1 remains comparatively stable, enabling robust measurements of ![]() .
.
Current usage metrics show cumulative count of Article Views (full-text article views including HTML views, PDF and ePub downloads, according to the available data) and Abstracts Views on Vision4Press platform.
Data correspond to usage on the plateform after 2015. The current usage metrics is available 48-96 hours after online publication and is updated daily on week days.
Initial download of the metrics may take a while.