Fig. 6
Download original image
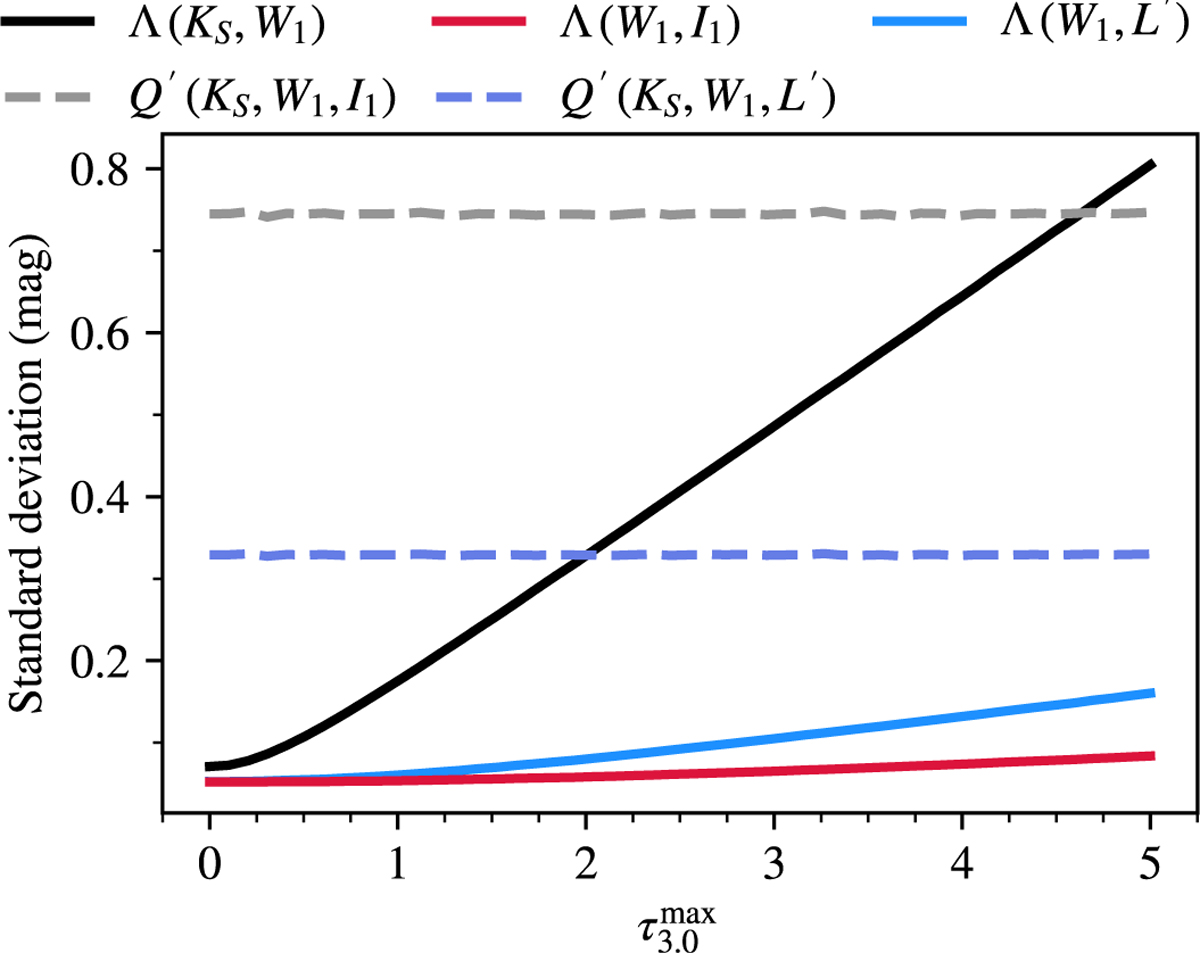
Standard deviation of Λ and Q′ color excess measurements as a function of the peak optical depth of the 3 μm feature, derived from randomly sampling uncertainties in the photometric parameters and the extinction law. Solid lines represent Λ for different band combinations: Λ(KS − W1) in black, Λ(W1 − I1) in red, and Λ(W1 − L′) in blue. Dashed lines show Q′ for the combinations Q′(KS, W1, I1) (gray) and Q′(KS, W1, L′) (dark blue). The simulation demonstrates that Λ(W1 − I1) and Λ(W1 − L′) maintain the lowest total uncertainties, even at high optical depths, due to the small wavelength separation between the bands.
Current usage metrics show cumulative count of Article Views (full-text article views including HTML views, PDF and ePub downloads, according to the available data) and Abstracts Views on Vision4Press platform.
Data correspond to usage on the plateform after 2015. The current usage metrics is available 48-96 hours after online publication and is updated daily on week days.
Initial download of the metrics may take a while.