Fig. 8
Download original image
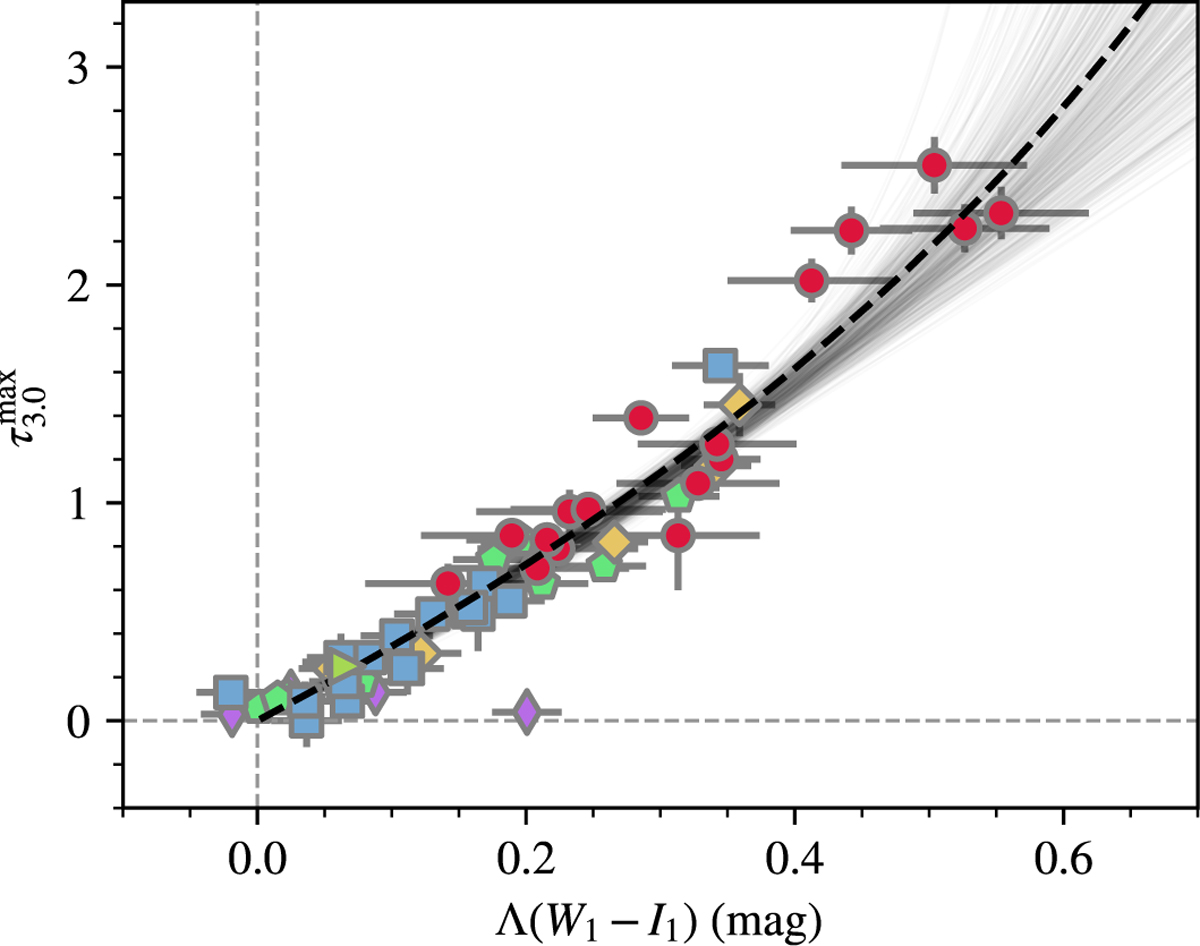
Peak optical depth of the 3 μm ice absorption feature (![]() ) as a function of the ice color excess Λ(W1 − I1) for the calibration sample. The various symbols represent the different literature sources listed in Table 1. Each point represents a literature measurement with propagated uncertainties. The black dashed line shows the best-fit relation, while thin solid lines represent 500 random samples from the fit parameter space. Gray dashed lines mark
) as a function of the ice color excess Λ(W1 − I1) for the calibration sample. The various symbols represent the different literature sources listed in Table 1. Each point represents a literature measurement with propagated uncertainties. The black dashed line shows the best-fit relation, while thin solid lines represent 500 random samples from the fit parameter space. Gray dashed lines mark ![]() = 0 and Λ(W1 − I1) = 0.
= 0 and Λ(W1 − I1) = 0.
Current usage metrics show cumulative count of Article Views (full-text article views including HTML views, PDF and ePub downloads, according to the available data) and Abstracts Views on Vision4Press platform.
Data correspond to usage on the plateform after 2015. The current usage metrics is available 48-96 hours after online publication and is updated daily on week days.
Initial download of the metrics may take a while.