Fig. 9
Download original image
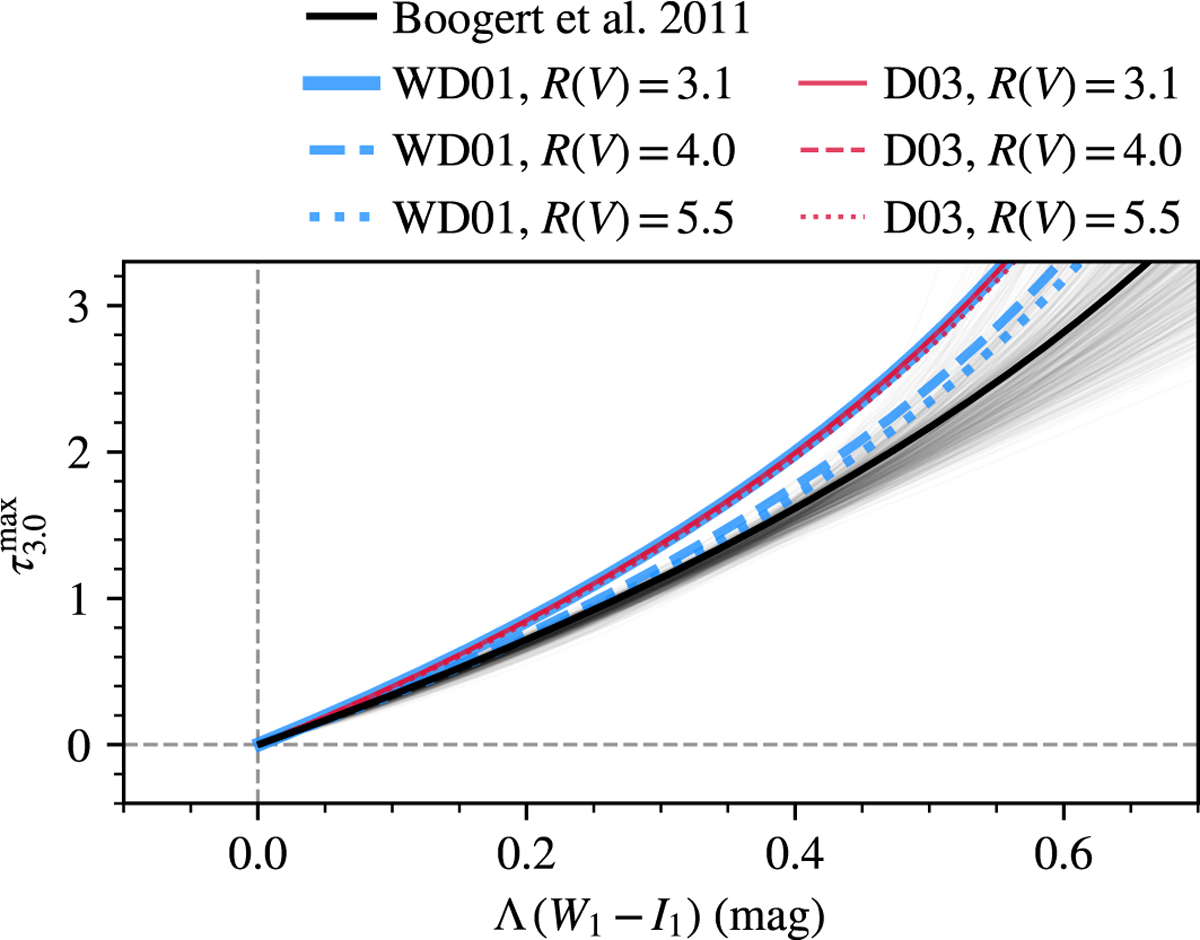
Relation between the peak optical depth of the 3.0 μm ice feature (![]() ) and the ice color excess Λ(W1 − I1) for different assumptions about the extinction law. The fitted curves correspond to extinction laws from Weingartner & Draine (2001) (blue), Draine (2003) (red), and Boogert et al. (2011) (black). While the use of the Λ(W1 − I1) metric minimizes the impact of extinction law uncertainties, systematic differences between the fits remain visible. However, these differences are generally within the typical measurement uncertainties of the calibration. This highlights the importance of adopting a consistent extinction law or recalibrating the method when applying it to different environments.
) and the ice color excess Λ(W1 − I1) for different assumptions about the extinction law. The fitted curves correspond to extinction laws from Weingartner & Draine (2001) (blue), Draine (2003) (red), and Boogert et al. (2011) (black). While the use of the Λ(W1 − I1) metric minimizes the impact of extinction law uncertainties, systematic differences between the fits remain visible. However, these differences are generally within the typical measurement uncertainties of the calibration. This highlights the importance of adopting a consistent extinction law or recalibrating the method when applying it to different environments.
Current usage metrics show cumulative count of Article Views (full-text article views including HTML views, PDF and ePub downloads, according to the available data) and Abstracts Views on Vision4Press platform.
Data correspond to usage on the plateform after 2015. The current usage metrics is available 48-96 hours after online publication and is updated daily on week days.
Initial download of the metrics may take a while.