Fig. 1.
Download original image
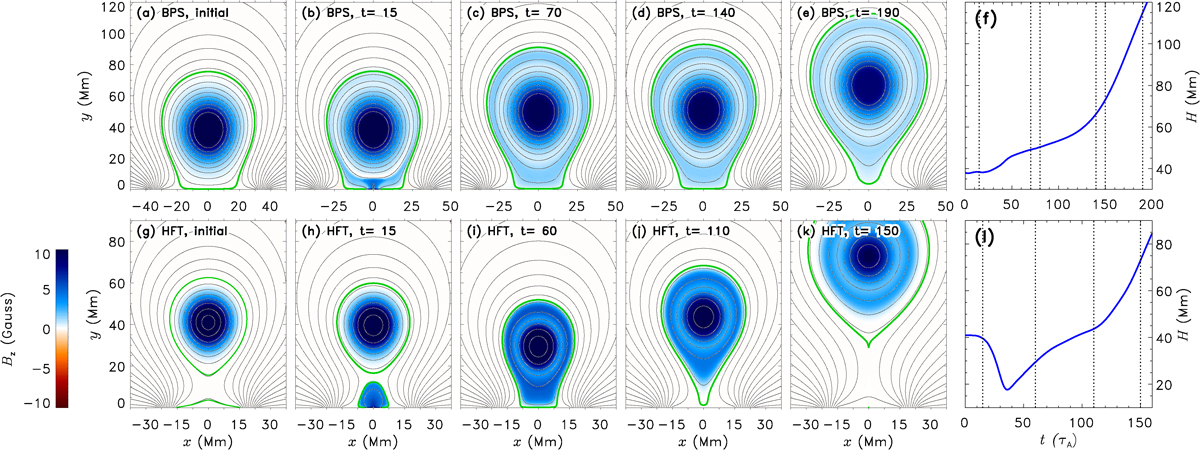
Coronal flux rope eruptions caused by normal flux feeding. The top panels show the simulation results of flux ropes in the BPS configuration, which were adapted from Zhang et al. (2020). The bottom panels show the results for the HFT configuration, adapted from Zhang et al. (2021b). The black curves in panels (a)–(e) and (g)–(k) illustrate the temporal evolution of the magnetic field configuration, the green curves mark the boundary of the flux rope and that of the emerging fibril (panel (h)), and the distribution of the axial magnetic flux in the z−direction is shown in blue and red. Panels (f) and (l) show the evolutions of the height of the flux rope axis. The vertical dotted lines in panels (f) and (g) correspond to the times of panels (a)–(e) and panels (g)–(k), respectively.
Current usage metrics show cumulative count of Article Views (full-text article views including HTML views, PDF and ePub downloads, according to the available data) and Abstracts Views on Vision4Press platform.
Data correspond to usage on the plateform after 2015. The current usage metrics is available 48-96 hours after online publication and is updated daily on week days.
Initial download of the metrics may take a while.