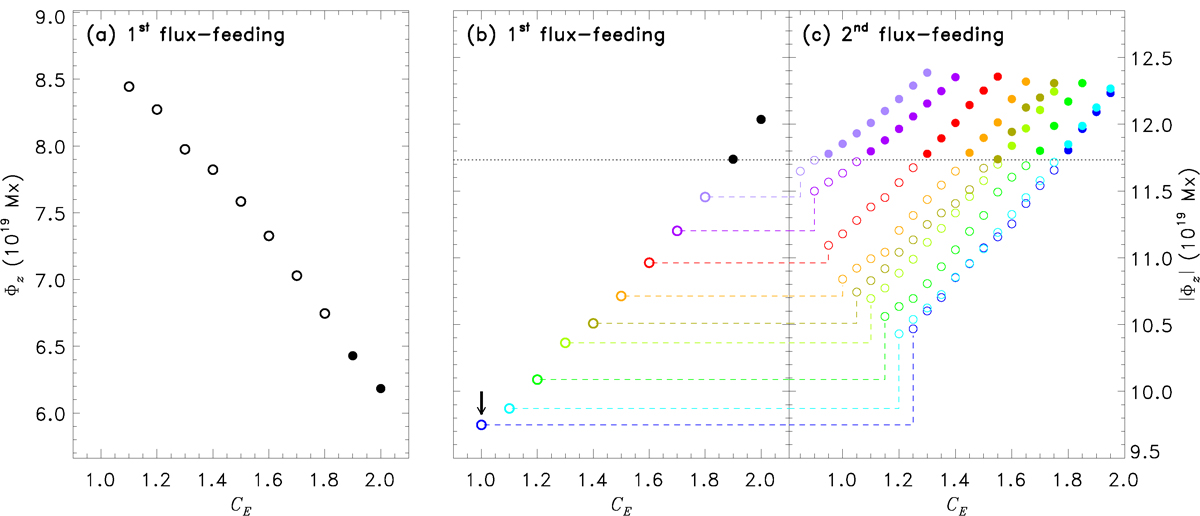
Fig. 4.
Download original image
Axial magnetic fluxes of the resultant major rope after inverse flux feeding with different CE. Φz and |Φz| of the resultant ropes after the first round of inverse flux feeding are plotted in panels (a) and (b), respectively, and panel (c) shows |Φz| of the resultant ropes after the second round of inverse flux feeding. The eruptive cases are plotted as dots, and the noneruptive cases are plotted as small circles. The correspondence between the cases in panel (c) and the corresponding new initial state is indicated by the dashed colored line.
Current usage metrics show cumulative count of Article Views (full-text article views including HTML views, PDF and ePub downloads, according to the available data) and Abstracts Views on Vision4Press platform.
Data correspond to usage on the plateform after 2015. The current usage metrics is available 48-96 hours after online publication and is updated daily on week days.
Initial download of the metrics may take a while.