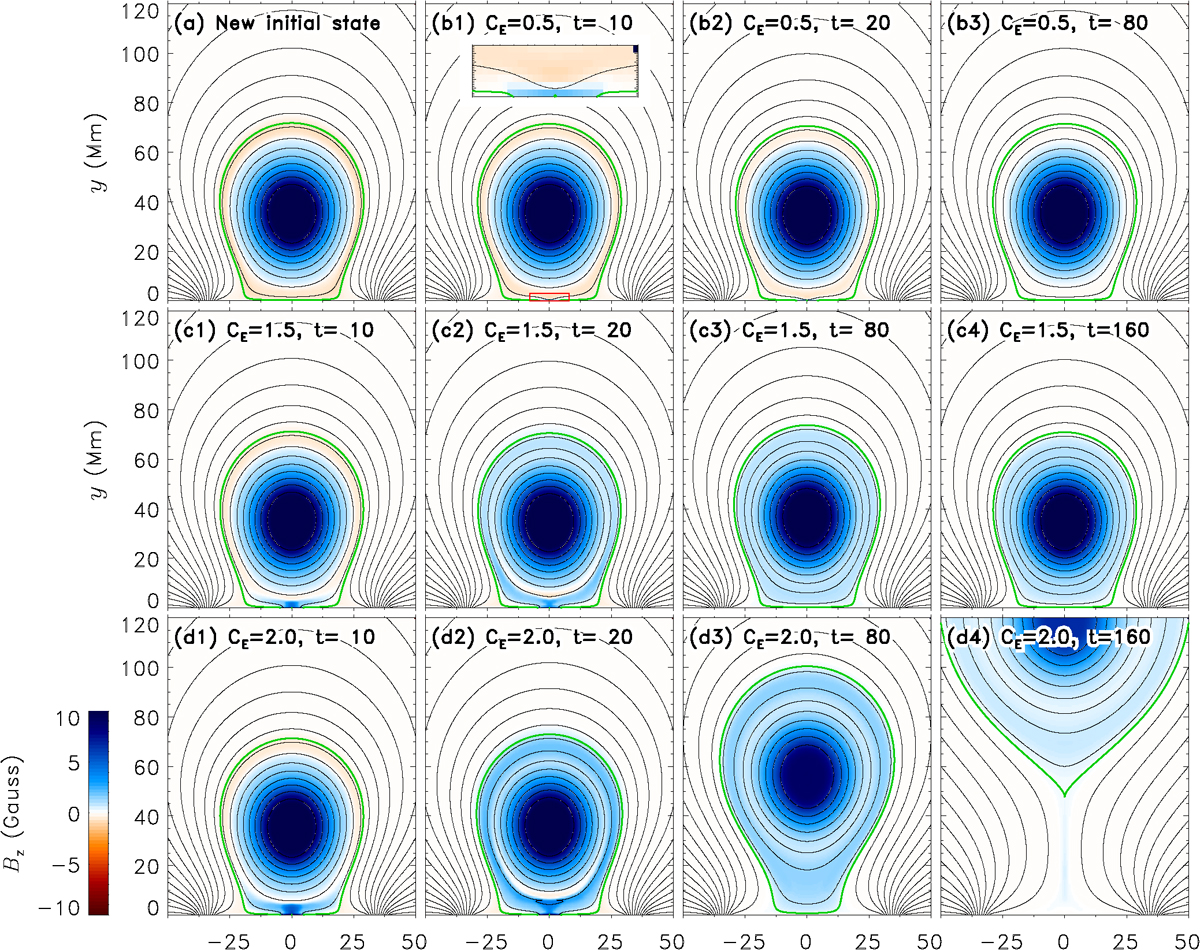
Fig. 6.
Download original image
Simulation results for the flux feeding processes in a flux rope system with double-layer configuration. Panel (a) shows the new initial state. Panels (b1)–(b3) show the evolution for the case with CE = 0.5, and the inset in panel (b1) corresponds to the region marked by the red box in panel (b). Panels (c1)–(c4) and panels (d1)–(d4) show the results for the cases with CE = 1.5 and CE = 2.0, respectively. The meanings of the symbols and colors are the same as in Fig. 1.
Current usage metrics show cumulative count of Article Views (full-text article views including HTML views, PDF and ePub downloads, according to the available data) and Abstracts Views on Vision4Press platform.
Data correspond to usage on the plateform after 2015. The current usage metrics is available 48-96 hours after online publication and is updated daily on week days.
Initial download of the metrics may take a while.