Fig. 20.
Download original image
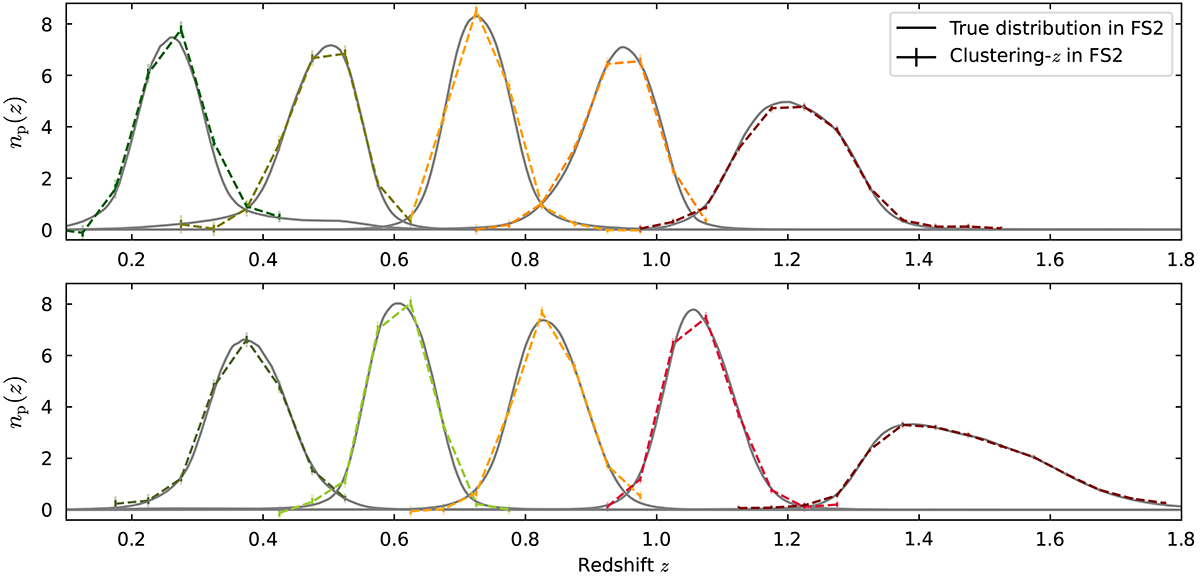
True-redshift distribution of the simulated Flagship2 ten tomographic bins with zp < 1.6 (solid lines) and their clustering-redshifts measurements with our pipeline, including all systematics and realistic bias correction M3. The first two bin measurements are realised with 2500 deg2 sky patches, and the other eight are realised with 1000 deg2 sky patches. The dark and light error bars indicate 68.3% and 95.5% uncertainties, but are barely visible by eye.
Current usage metrics show cumulative count of Article Views (full-text article views including HTML views, PDF and ePub downloads, according to the available data) and Abstracts Views on Vision4Press platform.
Data correspond to usage on the plateform after 2015. The current usage metrics is available 48-96 hours after online publication and is updated daily on week days.
Initial download of the metrics may take a while.