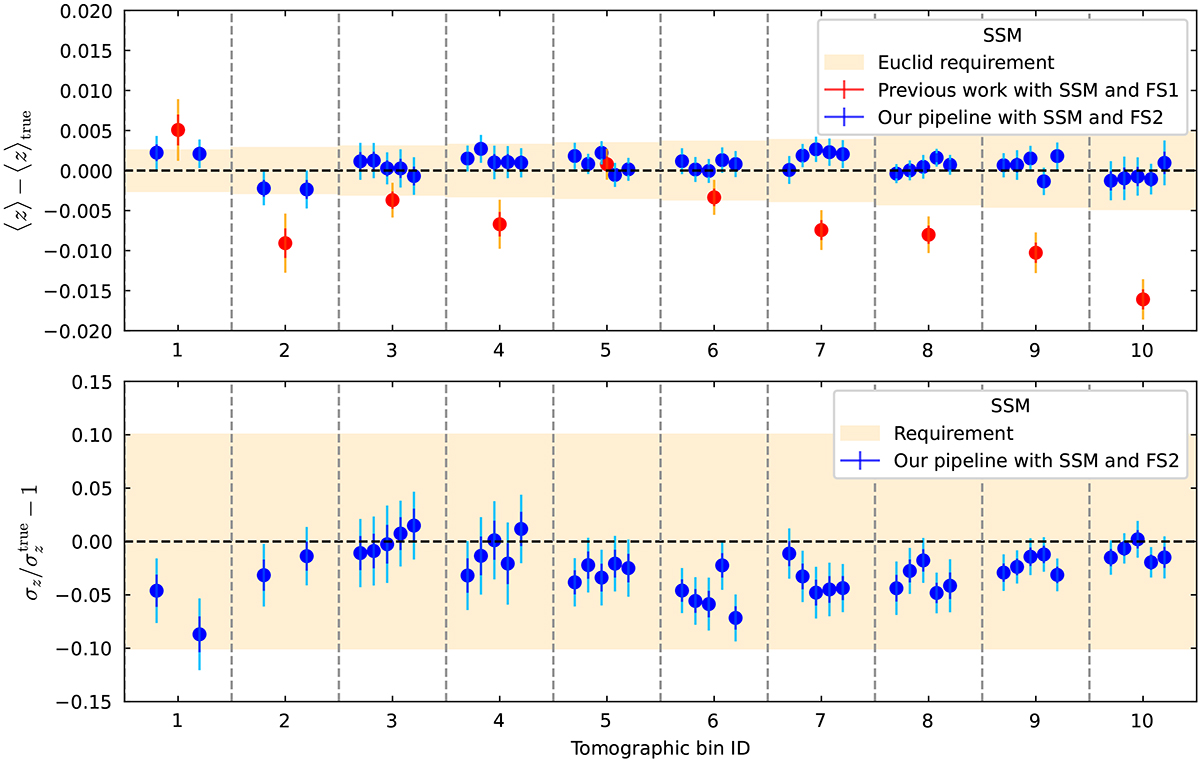
Fig. 21.

Download original image
Deviations in the mean redshift (top) and the redshift standard deviation (bottom) for the ten Flagship2 tomographic bins relative to the true-redshift distributions using the SSM method. The deviations are shown for each bin and sky patch. We consider patches of 2500 deg2 for the first two bins, and 1000 deg2 for the others. The Euclid requirements on the uncertainty are highlighted by the shaded area centred around zero. The uncertainties are consistent across all the bins for the mean redshift and we achieve a clear improvement from previous work shown in red. For the redshift standard deviations, the uncertainties are slightly underestimated, but this is within an acceptable range given the requirements.
Current usage metrics show cumulative count of Article Views (full-text article views including HTML views, PDF and ePub downloads, according to the available data) and Abstracts Views on Vision4Press platform.
Data correspond to usage on the plateform after 2015. The current usage metrics is available 48-96 hours after online publication and is updated daily on week days.
Initial download of the metrics may take a while.


