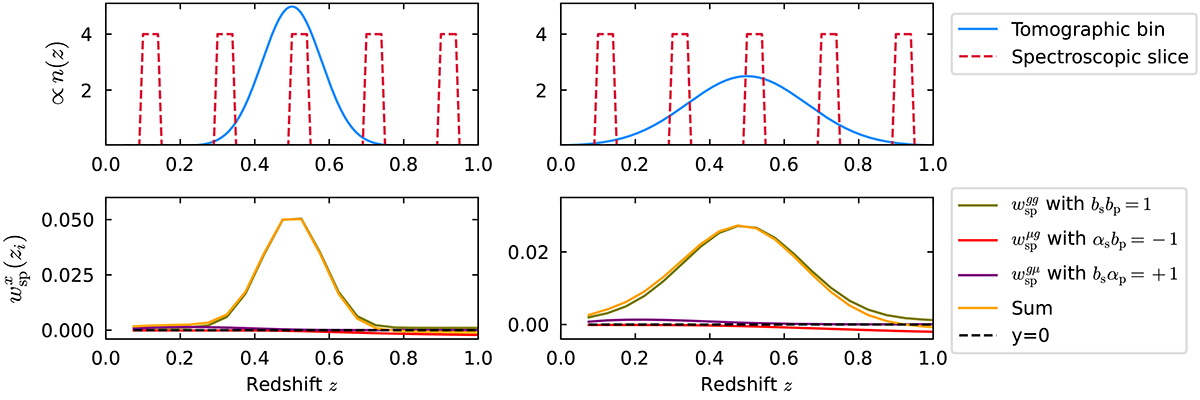
Fig. B.1.
Download original image
Top panel: The redshift distributions of the photometric sample (blue) and five out of the 20 spectroscopic samples (red) are shown. The photometric distribution on the left follows a Gaussian with parameters (μ, σ) = (0.5, 0.08), while on the right, it follows (μ, σ) = (0.5, 0.16). Bottom panel: The angular correlation is displayed for clustering only (green), magnification only (red and purple), and their sum (orange). The values of the coefficients b and α are provided in the legend. Magnification impacts the shape of the angular correlation (sum vs. clustering only) and may influence the mean redshift, particularly for larger tomographic bins (right vs. left).
Current usage metrics show cumulative count of Article Views (full-text article views including HTML views, PDF and ePub downloads, according to the available data) and Abstracts Views on Vision4Press platform.
Data correspond to usage on the plateform after 2015. The current usage metrics is available 48-96 hours after online publication and is updated daily on week days.
Initial download of the metrics may take a while.