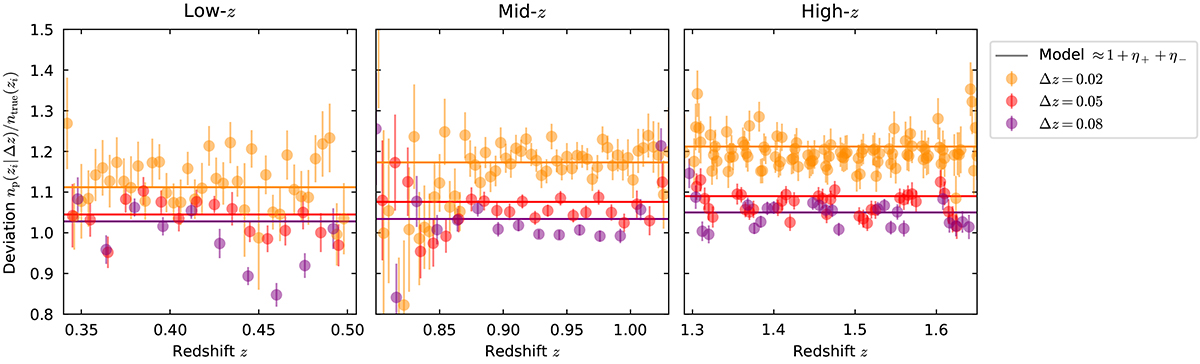
Fig. E.1.
Download original image
Deviation of the measured np(zi) to the true distribution, for different slicing Δz (points in colours), and the global offset predicted by our model, which includes correlation at the edge of the slices (solid lines in colours). The points correspond to the measurements for the five patches, hence the difference in redshift between them is not Δz.
Current usage metrics show cumulative count of Article Views (full-text article views including HTML views, PDF and ePub downloads, according to the available data) and Abstracts Views on Vision4Press platform.
Data correspond to usage on the plateform after 2015. The current usage metrics is available 48-96 hours after online publication and is updated daily on week days.
Initial download of the metrics may take a while.