Open Access
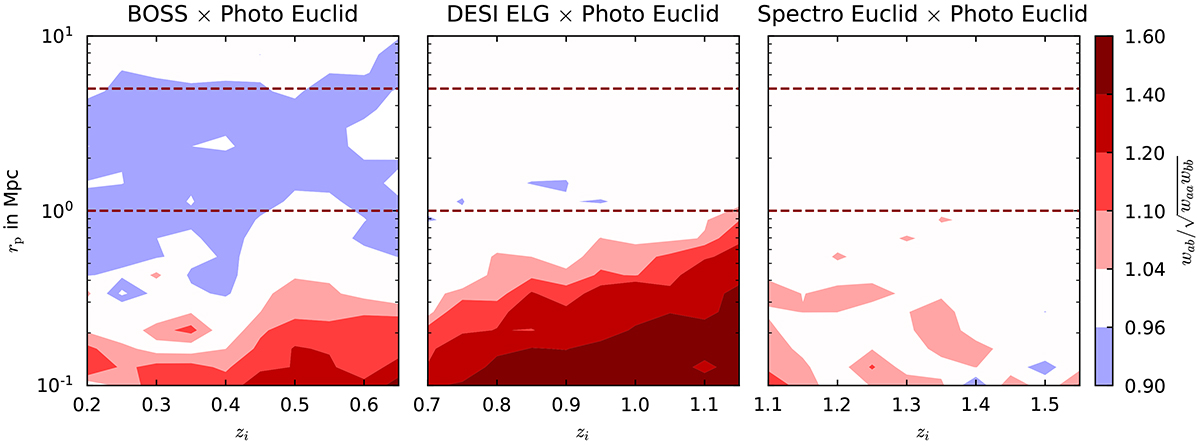
Fig. 8.
Download original image
Pearson coefficient for our three simulated bins: low-z, mid-z, and high-z. This term is assumed to be one for clustering-redshifts calibration. We see different behaviours, r = 1, r < 1, and r > 1 for different scales and redshifts, except for the high-z bin, for which r = 1 (almost) everywhere.
Current usage metrics show cumulative count of Article Views (full-text article views including HTML views, PDF and ePub downloads, according to the available data) and Abstracts Views on Vision4Press platform.
Data correspond to usage on the plateform after 2015. The current usage metrics is available 48-96 hours after online publication and is updated daily on week days.
Initial download of the metrics may take a while.