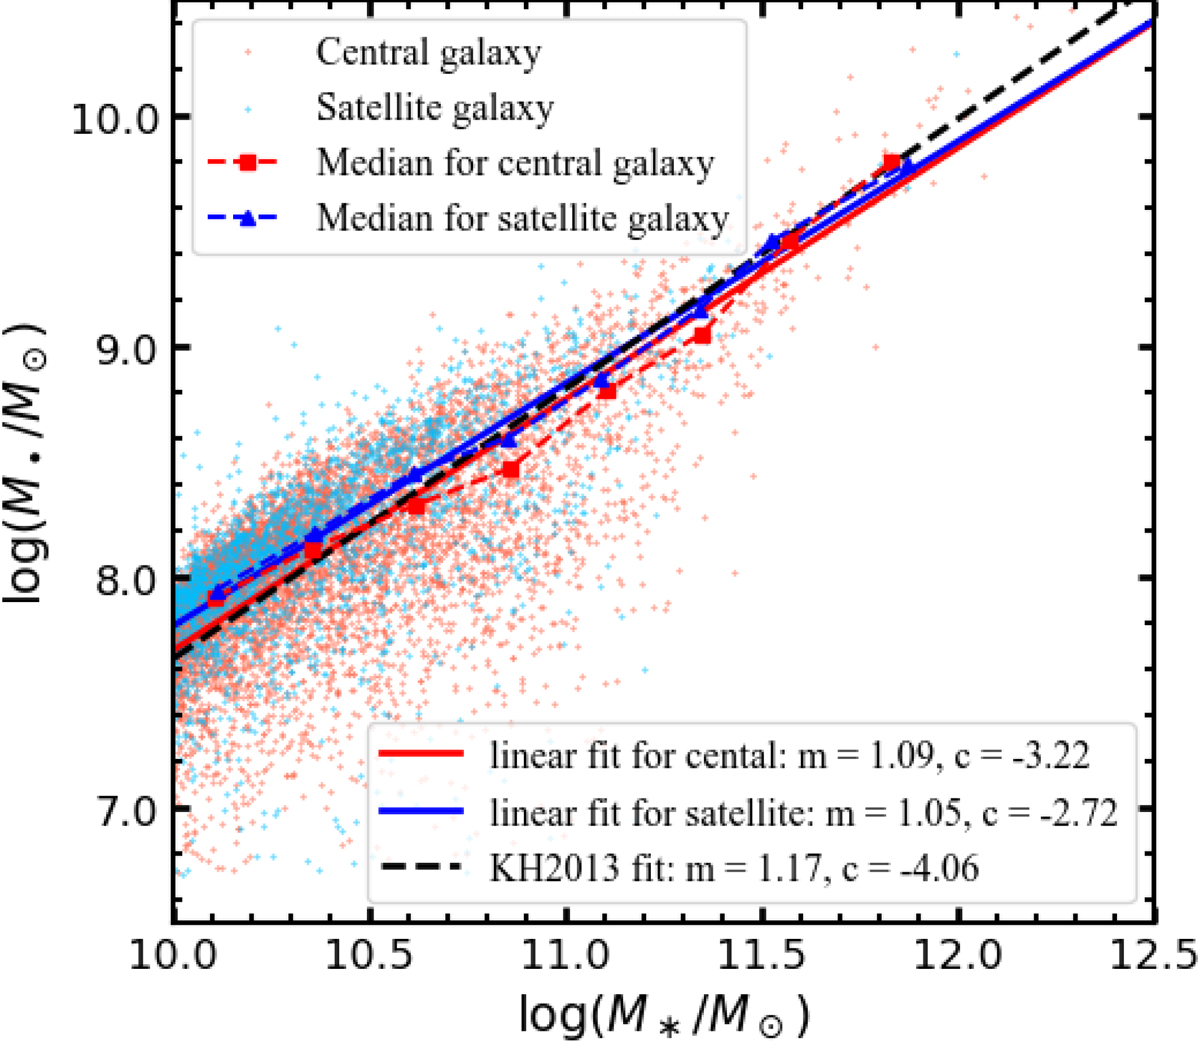
Fig. 1.
Download original image
Scaling relation between M• and M* for central and satellite galaxies, shown as red and cyan dots, respectively. The best-fit power-law relations for central (red line) and satellite galaxies (blue line) are compared to the observational results from Kormendy & Ho (2013) (KH2013, dashed black line), and the best-fit parameters are given in the lower-right legend. The plot highlights the very small discrepancy between central and satellite galaxies and the observed relation.
Current usage metrics show cumulative count of Article Views (full-text article views including HTML views, PDF and ePub downloads, according to the available data) and Abstracts Views on Vision4Press platform.
Data correspond to usage on the plateform after 2015. The current usage metrics is available 48-96 hours after online publication and is updated daily on week days.
Initial download of the metrics may take a while.