Fig. 2.
Download original image
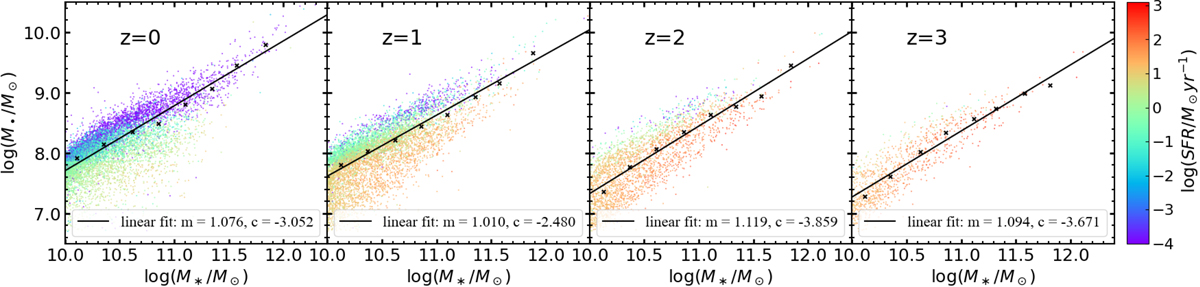
Scaling relation between M• − M* for galaxies at z = 0, z = 1, z = 2, and z = 3, shown from left to right, colour-coded by log SFR. The median M• value in each M* bin is shown as black dots. The black lines represent the best-fit relation to these median values and are used as the median M• − M* scaling relation when calculating residuals. The best-fit parameters are presented in the legend at the bottom. Galaxies with lower SFR at a given M* tend to host more massive BHs.
Current usage metrics show cumulative count of Article Views (full-text article views including HTML views, PDF and ePub downloads, according to the available data) and Abstracts Views on Vision4Press platform.
Data correspond to usage on the plateform after 2015. The current usage metrics is available 48-96 hours after online publication and is updated daily on week days.
Initial download of the metrics may take a while.