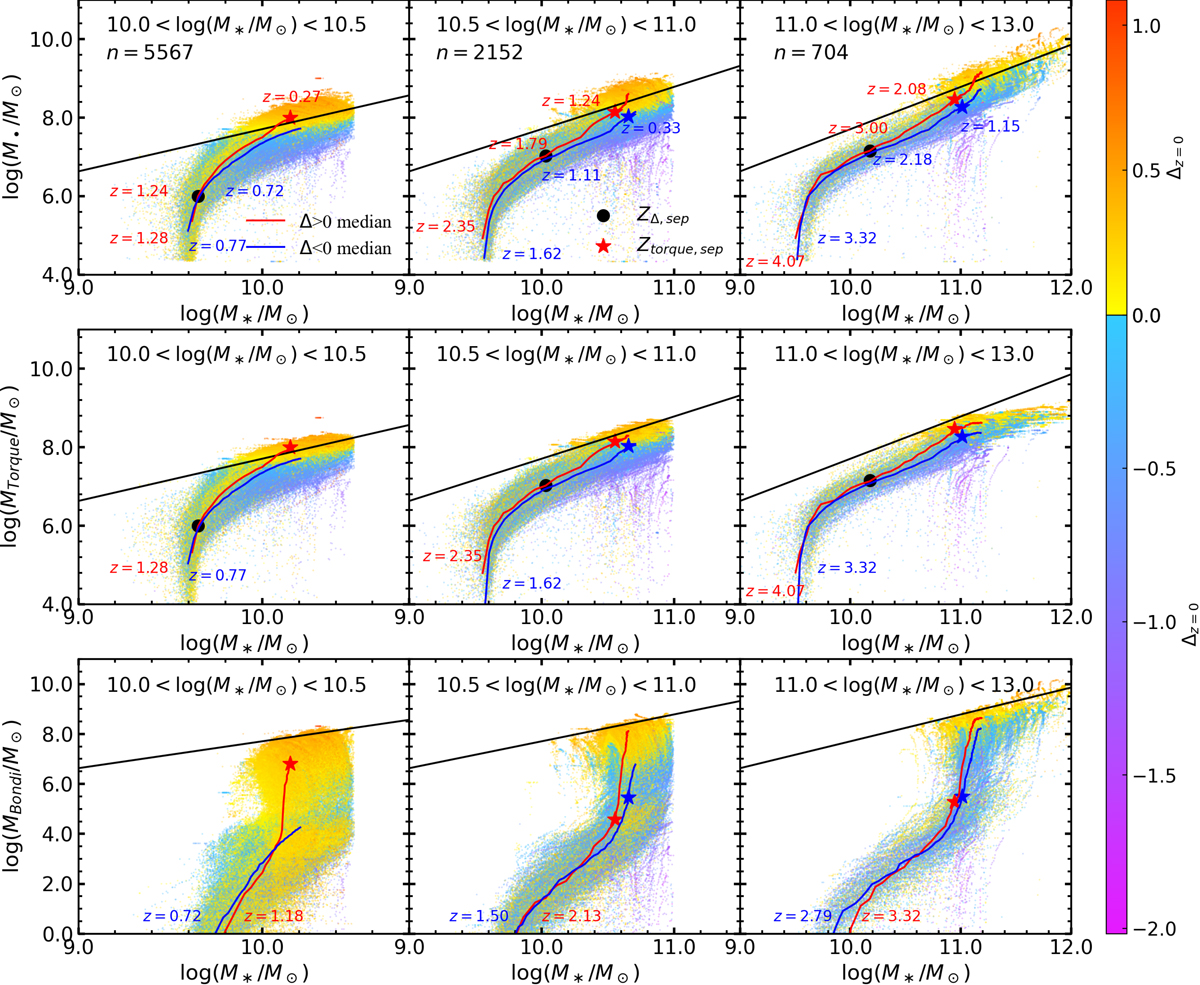
Fig. 6.
Download original image
Galaxy and BH coevolution history traced by M* and BH masses. Panels from top to bottom show the M• − M*, MTorque − M* and MBondi − M* relations as data points colour-coded by their residuals at z = 0 (Δz = 0). Columns from left to right show galaxies with stellar mass at z = 0 in the ranges 10.0 < log(M*/M⊙) < 10.5, 10.5 < log(M*/M⊙) < 11, and 11.0 < log(M*/M⊙) < 13. The galaxy number (n) in each stellar mass bin at z = 0 is given in the top-left corner. For reference, we show the scaling relation at z = 0 from Figure 2 as a black solid line. Median growth histories for galaxies with Δ > 0 and Δ < 0 are shown as red and blue solid lines, respectively, with the start redshifts of growth labelled. The separation time ZΔ, sep of M• − M* growth histories for the Δ > 0 and Δ < 0 populations, defined as the epoch when variance between their median growth trajectories first exceeds 0.1 dex, is indicated by large black dots. The separation time ZTorque, sep between the median M• − M* and MTorque − M* is marked with filled stars: red for Δ > 0 and blue for Δ < 0. To highlight these differences, the redshifts of ZΔ, sep and ZTorque, separe labelled in the first row, in red for Δ > 0 and blue for Δ < 0.
Current usage metrics show cumulative count of Article Views (full-text article views including HTML views, PDF and ePub downloads, according to the available data) and Abstracts Views on Vision4Press platform.
Data correspond to usage on the plateform after 2015. The current usage metrics is available 48-96 hours after online publication and is updated daily on week days.
Initial download of the metrics may take a while.