Fig. 7.
Download original image
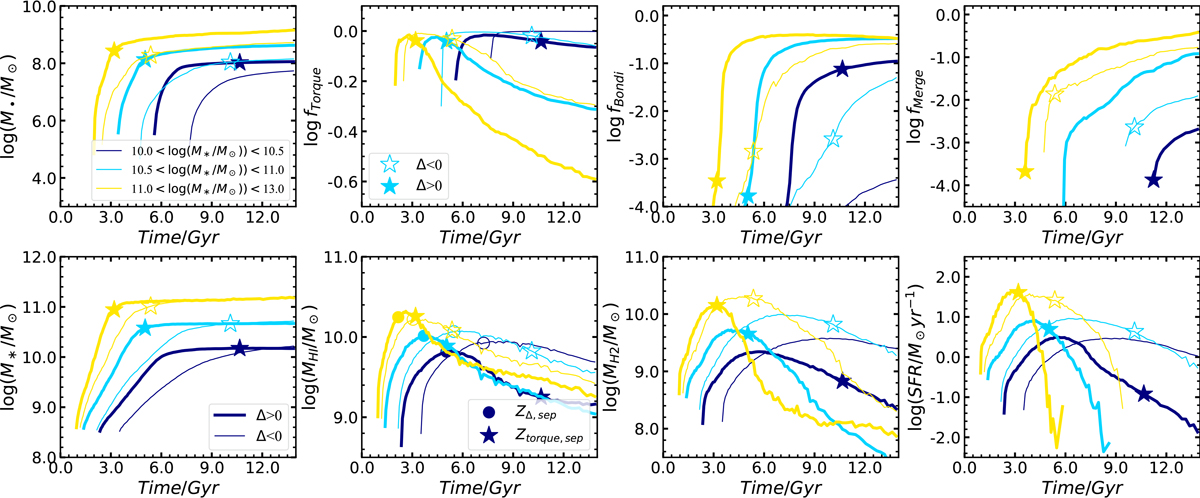
Median growth histories for different galaxy quantities. The top row shows the evolution of M•, fTorque, fBondi, and fMerge with time from left to right. The bottom row shows the evolution of M*, ![]() , MH2, and SFR with time from left to right. Galaxies with stellar masse ranges 10.0 < log(M*/M⊙) < 10.5, 10.5 < log(M*/M⊙) < 11, and 11.0 < log(M*/M⊙) < 13 are shown as navy, cyan, and yellow lines, respectively. Galaxies with Δ > 0 and Δ < 0 are represented by thick and thin lines, respectively. The separation times ZΔ, sep (for theM• − M* relation between Δ > 0 and Δ < 0) and ZTorque, sep (for the M• − M* and MTorque − M* relation; see the description in Figure 6) are indicated as filled circles and stars for Δ > 0, and by open symbols for Δ < 0.
, MH2, and SFR with time from left to right. Galaxies with stellar masse ranges 10.0 < log(M*/M⊙) < 10.5, 10.5 < log(M*/M⊙) < 11, and 11.0 < log(M*/M⊙) < 13 are shown as navy, cyan, and yellow lines, respectively. Galaxies with Δ > 0 and Δ < 0 are represented by thick and thin lines, respectively. The separation times ZΔ, sep (for theM• − M* relation between Δ > 0 and Δ < 0) and ZTorque, sep (for the M• − M* and MTorque − M* relation; see the description in Figure 6) are indicated as filled circles and stars for Δ > 0, and by open symbols for Δ < 0.
Current usage metrics show cumulative count of Article Views (full-text article views including HTML views, PDF and ePub downloads, according to the available data) and Abstracts Views on Vision4Press platform.
Data correspond to usage on the plateform after 2015. The current usage metrics is available 48-96 hours after online publication and is updated daily on week days.
Initial download of the metrics may take a while.