Fig. 8.
Download original image
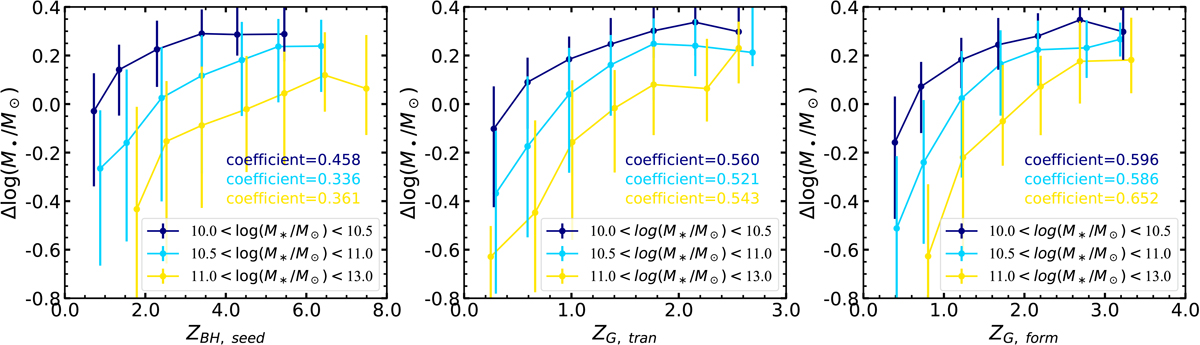
Relation between residuals and the redshifts of BH seeding (ZBH, seed, left panel), galaxy transition (ZG, tran, middle panel), and galaxy formation (ZG, form, right panel). Galaxies with stellar mass ranges 10.0 < log(M*/M⊙) < 10.5, 10.5 < log(M*/M⊙) < 11, and 11.0 < log(M*/M⊙) < 13 are shown as navy, cyan, and yellow lines, respectively, with errors estimated from the 16th to 84th percentile ranges. Correlation coefficients for each stellar mass bin are shown in each panel in the corresponding colours.
Current usage metrics show cumulative count of Article Views (full-text article views including HTML views, PDF and ePub downloads, according to the available data) and Abstracts Views on Vision4Press platform.
Data correspond to usage on the plateform after 2015. The current usage metrics is available 48-96 hours after online publication and is updated daily on week days.
Initial download of the metrics may take a while.