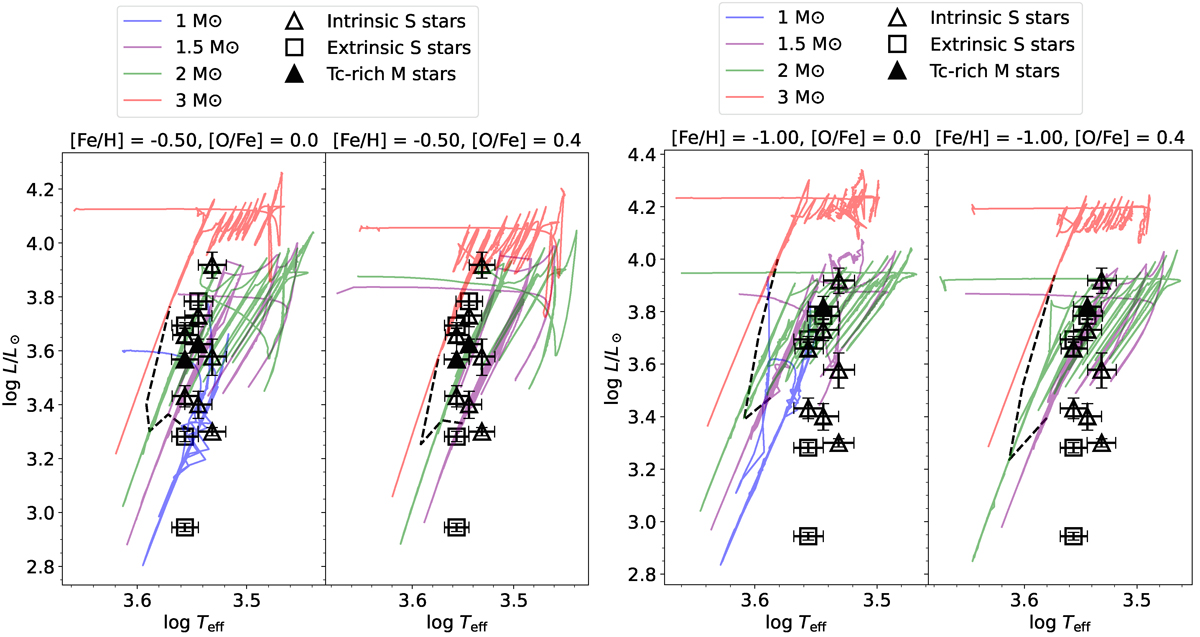
Fig. 3.
Download original image
Locations of the Tc-rich M stars AA Cam, OP Her, and RX Lac (filled triangles) in the HR diagram. The HR diagrams also include STAREVOL evolutionary tracks corresponding to the closest available metallicities ([Fe/H] = –0.5 or –1.0) with [O/Fe] = 0 and 0.4, hence AA Cam and OP Her appear in the left sub-panels, while RX Lac is shown in the right sub-panels. The dashed black line marks the predicted onset of the TDU, that is, the lowest stellar luminosity following the first occurrence of a TDU episode. For comparison, Tc-rich S stars (empty triangles) from Shetye et al. (2021) and Tc-poor S stars (empty squares) from Shetye et al. (2018) with metallicities around [Fe/H] = –0.5 are included.
Current usage metrics show cumulative count of Article Views (full-text article views including HTML views, PDF and ePub downloads, according to the available data) and Abstracts Views on Vision4Press platform.
Data correspond to usage on the plateform after 2015. The current usage metrics is available 48-96 hours after online publication and is updated daily on week days.
Initial download of the metrics may take a while.