| Issue |
A&A
Volume 702, October 2025
|
|
|---|---|---|
| Article Number | A39 | |
| Number of page(s) | 16 | |
| Section | Stellar structure and evolution | |
| DOI | https://doi.org/10.1051/0004-6361/202555581 | |
| Published online | 01 October 2025 | |
Technetium-rich M stars: Prime diagnostics of recent third dredge-up events on the asymptotic giant branch
1
Instituut voor Sterrenkunde, KU Leuven, Celestijnenlaan 200D bus 2401, Leuven 3001, Belgium
2
Institute of Astronomy and Astrophysics (IAA), Université libre de Bruxelles (ULB), CP 226, Boulevard du Triomphe, B-1050 Bruxelles, Belgium
3
Instituto de Astrofísica de Canarias, C. Vía Láctea, s/n, 38205 La Laguna, Santa Cruz de Tenerife, Spain
4
Universidad de La Laguna, Dpto. Astrofísica, Av. Astrofísico Francisco Sánchez, 38206 La Laguna, Santa Cruz de Tenerife, Spain
5
Institute of Applied Physics, TU Wien, Wiedner Hauptstraße 8-10, 1040 Vienna, Austria
6
Department of Mathematics, KU Leuven Kulak campus, Etienne Sabbelaan 53, 8500 Kortrijk, Belgium
⋆ Corresponding author: This email address is being protected from spambots. You need JavaScript enabled to view it.
Received:
19
May
2025
Accepted:
21
July
2025
Abstract
Context. Technetium (Tc)-rich M stars have been known for more than 45 years. However, the origin of Tc in these stars, particularly its detection without the concomitant detection of other s-process elements, which are typically produced during asymptotic giant branch (AGB) s-process nucleosynthesis, remains poorly understood. Technetium was first identified in the spectra of S stars (which exhibit prominent ZrO bands) in 1952. The simultaneous enrichment of both Zr and Tc is well understood within the framework of s-process nucleosynthesis, which occurs during the AGB phase. However, Tc-rich M stars remain an enigma, as M stars are typically not enriched in heavy elements.
Aims. This study aims to analyse high-resolution spectra of a large sample of M stars to examine their spectral characteristics, and to compare their spectral properties with those of Tc-rich S stars in an attempt to understand the origin of their difference.
Methods. We defined a robust classification scheme to assign M stars to the Tc-rich or Tc-poor class. We computed nucleosynthesis models to trace the evolution of Zr and Tc abundances across successive thermal pulses during the AGB phase. We further analysed spectral indices measuring the depth of the TiO and ZrO bands, as well as the wavelength of the Tc blend, on both synthetic and observed spectra.
Results. The Tc lines in Tc-rich M stars are similar to those in S stars. However, Tc-rich M stars exhibit stronger TiO bands than S stars, while displaying similarly strong ZrO bands. Spectral synthesis, together with location in the Hertzsprung–Russell (HR) diagram and spatial properties, suggests that Tc-rich M stars may have slightly lower metallicity and lower masses than Tc-rich S stars.
Key words: stars: abundances / stars: AGB and post-AGB / stars: chemically peculiar / Hertzsprung–Russell / C-M diagrams
© The Authors 2025
 Open Access article, published by EDP Sciences, under the terms of the Creative Commons Attribution License (https://creativecommons.org/licenses/by/4.0), which permits unrestricted use, distribution, and reproduction in any medium, provided the original work is properly cited.
This article is published in open access under the Subscribe to Open model. This email address is being protected from spambots. You need JavaScript enabled to view it. to support open access publication.
1. Introduction
The unstable slow neutron capture nucleosynthesis (s-process) element technetium (Tc) was first detected in the spectra of evolved stars by Merrill (1952). Technetium, along with other s-process elements, is synthesised via s-process nucleosynthesis during the thermally pulsing asymptotic giant branch (TP-AGB) phase. These elements are subsequently transported from the stellar interior to the surface through third dredge-up (TDU) episodes, where they become observable in stellar spectra. Since only 99Tc is produced in significant amounts by the s-process, and has a half-life of 2 × 10⁵ years, its detection in stellar photospheres serves as a clear indicator of ongoing s-process nucleosynthesis in TP-AGB stars. This distinguishes such stars from extrinsic s-process-enriched systems, where the observed chemical enhancements result from past mass transfer from a former AGB companion in a binary system (Shetye et al. 2018). For a detailed review on s-process-enhanced stars, we refer the reader to the recent review by Van Eck et al. (2022).
Technetium-rich M stars present a significant challenge in understanding TDU physics and AGB nucleosynthesis. Little-Marenin & Little (1979) first detected Tc lines in the spectra of several M stars. These stars are characterised by prominent TiO and VO bands, with only weak ZrO bands. As an AGB star evolves, recurrent TDU episodes enrich its surface with s-process elements, including zirconium (Zr), strengthening the ZrO bands relative to TiO. This marks the transition from spectral type M to S, where both TiO and ZrO bands are prominent. As the star transports carbon (a product of He burning) to the surface through TDU, the star undergoes a chemical shift from an oxygen-rich to a carbon-rich composition, eventually becoming a carbon (C) star. Thus, AGB stars are traditionally understood to follow the M → MS → S → SC → C spectral sequence. The presence of Tc in M stars with weak or absent ZrO bands (indicating minimal s-process enrichment beyond Tc) suggests two possible scenarios. First, these stars may represent the earliest stages of the thermally pulsing AGB phase, having experienced only one or a few thermal pulses, tracing the onset of TDU. Alternatively, they could be sites of an alternative s-process mechanism in which Tc is produced without a corresponding enhancement of Zr (Vanture et al. 1991).
The discovery of a growing number of Tc-rich M stars has been made possible by the increasing availability of high-resolution spectra, which enable the detection and analysis of weak blue Tc I lines. In contrast, earlier classifications of M and S stars relied primarily on TiO and ZrO molecular bands, which are prominent in low-resolution spectra. Hence, the apparent scarcity of Tc-rich M stars does not necessarily mean that they are rare, but rather that they are challenging to detect. In Shetye et al. (2022), we conducted a pilot study of the Tc-rich M star S Her using high-resolution spectroscopy. In the present work, we expand on that study by presenting a detailed spectroscopic analysis of 39 M stars to further investigate the spectral properties of this class of objects. The sample selection and observational details are described in Sect. 2, and the detection of Tc within our sample is presented in Sect. 3. The spectral characteristics of the sample stars are examined in Sects. 4 and 5. Subsequently, Sect. 6 presents an analysis of the stellar parameters, metallicities, and positions in the Hertzsprung–Russell (HR) diagram for a subsample of stars. In Sect. 7, we examine the nucleosynthesis predictions used to investigate the nature of Tc-rich M stars. The kinematics of Tc-poor, Tc-rich M stars, and Tc-rich S stars are compared in Sect. 8. Finally, our results are discussed in Sect. 9, and the main conclusions of this study are summarised in Sect. 10.
2. Observational sample
We obtained high-resolution optical spectroscopic data from the HERMES1 spectrograph (Raskin et al. 2011) for a sample of M stars. The radial velocity of each spectrum was determined by measuring the barycentre of its cross-correlation function. The cross-correlation function was computed using a line mask designed from a high signal-to-noise (S/N) HERMES spectrum of an M4 star. The spectral resolution is R = 86 000 and the typical S/N of our sample spectra is 30 in the V-band, providing sufficient quality to detect the technetium lines, if present. However, for five stars, namely U Per, T Cep, R Aqr, RX Lac, and Y And, the SNR was sufficient for the detection of Tc, but not for the calculation of the spectral indices discussed in Sects. 4 and 5. The sample stars and their basic properties are presented in Table B.1.
The selection of this sample was guided by the following specific criteria. First, we used the list of M stars from Little et al. (1987) as the starting point. From this dataset, only stars meeting the following conditions were included: a declination δ ≥ −30°, an apparent magnitude V ≤ 11 (with the average V-magnitude adopted for variable stars), and the availability of a Gaia data release 2 parallax. Next, we calculated the bolometric magnitudes using Gaia parallaxes and JohnsonV − K (Ducati 2002) colour indices for all candidate stars. These calculations assumed a standard interstellar reddening value of 0.1 mag and applied a bolometric correction in the K-band of 3.0 mag. Finally, based on the Mbol and V − K range of Tc-rich M stars from Uttenthaler et al. (2011), we established a specific selection region, namely −6 ≤ Mbol ≤ −3 and 5 ≤ V − K ≤ 12. This criterion allowed us to identify M stars with a high probability of being Tc-rich. Indeed, as shown in the next section, 46% of the M star sample proved to be Tc-rich.
3. Confirmation of the presence of Technetium
The three Tc I resonance lines located at 4238.19, 4262.27, and 4297.06 Å were used to detect the presence or absence of Tc in our sample stars. We present the Tc lines of the Tc-rich M stars in Figs. B.1 and B.2; the corresponding Tc-poor M stars are shown in Figs. B.3 and B.4.
We identified 18 stars as Tc-rich based on the presence of absorption features in either two or all three Tc lines. Among these, R Vir and Y And were previously classified as Tc-poor by Little et al. (1987), but Fig. B.2 unambiguously proves that they are Tc-rich. The stars V Mon, ST Her, U Per, T Cas, and RZ Her were labelled as ‘probable’ Tc-rich candidates by Little et al. (1987). Of these, ST Her was later confirmed as Tc-rich by Lebzelter & Hron (1999), and we confirm the Tc-rich nature of the remaining stars in this work. The other Tc-rich candidates in our sample were identified as such in previous studies, including Little-Marenin & Little (1979), Little et al. (1986), Smith & Lambert (1988), Jorissen et al. (1993), Lebzelter & Hron (1999), Uttenthaler et al. (2011), and our findings are consistent with these classifications.
Based on the spectral features shown in Figs. B.3 and B.4, we classified 21 stars in our sample as Tc-poor. Previously, Little et al. (1987) labelled TV Psc, RV Boo, V1351 Cyg, NZ Gem, and UV Her as ‘doubtful’, noting that any lines at the Tc I positions were either too weak or heavily blended, suggesting the absence of Tc. In this study, we confirm these stars as Tc-poor, except for RT Cyg, where the low S/N of our spectra prevents a definitive classification. Similarly, Little et al. (1987) classified X Oph, R CVn, and V Cas as ‘possible’, meaning the Tc lines in their spectra were weak or blended, with a preference for the presence of Tc. However, our analysis shows no clear absorption features at the Tc lines for X Oph and R CVn. While the S/N of the V Cas spectrum is low (Fig. B.4), the Tc lines at 4262.27 Å and 4297.06 Å suggest a Tc-poor classification for this star. Lebzelter & Hron (1999) classified V Boo as Tc-rich, although they expressed uncertainty about this classification and noted the need for high-resolution data to confirm it. Based on our analysis, we identify the star as Tc-poor. The remaining Tc-poor stars in our sample were previously identified as such by Little et al. (1987), Smith & Lambert (1988), Lebzelter & Hron (1999, 2003). Because most Tc-rich M stars appear to be cool, large-amplitude variables (Table B.1) with spectral type (and hence temperature) varying over the pulsation cycle, their abundance analysis proved to be extremely difficult (Shetye et al. 2022). The abundances of Tc (and Zr) could therefore not be derived for any of our sample stars, with the exception of the low-variability MS star AA Cam (Table B.1), analysed by Shetye et al. (2021).
4. Technetium line fitting
Spectral synthesis rarely produces a satisfactory fit at the location of the blue Tc lines. Therefore, the presence or absence of the Tc lines determined in Sect. 3 was confirmed as described by Van Eck & Jorissen (1999). The shape and position of the blends for the two Tc lines at 4238 Å and 4262 Å exhibit distinct characteristics in Tc-rich and Tc-poor stars. The Nb I–Gd II (–Tc I) blend, referred to here as the λ4262 feature, is significantly influenced by the presence or absence of the Tc line. Similarly, the CH–La II blend associated with the Tc line at 4238 Å is designated as the λ4238 feature. We fitted a Gaussian to these two Tc features for both Tc-rich and Tc-poor stars and derived the wavelength corresponding to the minimum of the fit. According to Van Eck & Jorissen (1999), the minimum of the λ4262 feature in Tc-rich stars is redshifted by approximately 0.14 Å compared to that in Tc-poor stars. In contrast, the minimum of the λ4238 feature shows a blueshift of approximately 0.2 Å in Tc-rich stars.
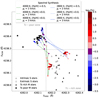 |
Fig. 1. Central wavelengths of the Tc I blends at λ4238 and λ4262 Tc I. The dashed grey lines delineate the boundaries between the Tc-poor zone (upper left rectangle) and the Tc-rich region (lower-right rectangle, Van Eck & Jorissen 1999). Observed data points are shown as squares and triangles, corresponding to measurements of (λ4238, λ4262) in spectra of Tc-rich and Tc-poor M and S stars, as labelled. Synthetic spectra were generated for two effective temperatures (Teff = 2800 K and 4000 K), two metallicities ([Fe/H] = 0.0 and –0.5), two microturbulence velocities (χt = 2 and 3 km/s), and a range of Tc abundances (as indicated by the colour scale on the side). From these synthetic spectra, the central wavelengths of the λ4238 and λ4262 Tc I blends were measured. The results are represented as coloured circles, connected by lines that group models with the same atmospheric parameters, as indicated by the labels. |
In Fig. 1, the wavelengths of the λ4238 feature are plotted against those of the λ4262 feature. The separation between Tc-rich and Tc-poor stars in this plane is strikingly clear. The Tc-rich M stars occupy the same region as the Tc-rich S stars, while the Tc-poor M and S stars are similarly grouped together. The two Tc blends (at λ4238 and λ4262) consistently yield the same results with respect to the presence or absence of the Tc lines. Close inspection of the Tc-rich M-star properties suggest that the increased scatter in the lower right part of Fig. 1 may be related to the cooler temperatures and stronger variability (atmospheric dynamics) in these stars, which are generally more evolved than their Tc-poor counterparts.
For comparison, we applied the same Tc-line fitting to synthetic spectra. These spectra were generated using the radiative transfer code Turbospectrum (Alvarez & Plez 1998; Plez 2012) combined with MARCS model atmospheres for S stars from Van Eck et al. (2017). Synthetic spectra were computed for varying Tc abundances, spanning log ϵ (Tc) from −3.5 to 2.5, and for two extreme temperatures from the MARCS grid of S stars, namely 2800 K and 4000 K. We also considered two metallicities, [Fe/H] = 0.0 and −0.5, and investigated the impact of microturbulence by computing synthetic spectra for χt = 2 and 3 km/s. The MARCS models of S stars from Van Eck et al. (2017) provide a selection of C/O and [s/Fe] ratios covering the typical s-process and carbon abundances observed in S stars. For our analysis, we used synthetic models with a fixed C/O ratio of 0.5 and [s/Fe] = 0 dex to closely match the composition of M stars.
In the synthetic spectra, the wavelength of the minimum for both features exhibits a clear dependence on the effective temperature. Metallicity, in turn, impacts the minimum Tc abundance required for the star to be classified as Tc-rich. Notably, a step of 0.5 dex in log ϵ (Tc) is sufficient to shift a star from the Tc-poor zone to the Tc-rich zone. The smallest Tc abundance for Tc-rich stars is log ϵ(Tc) = − 0.5 and occurs for spectral synthesis computed with Teff = 4000 K and [Fe/H] = –0.5. These detection limits may only be appropriate for M stars. Tc-rich S stars exhibit Tc features even at relatively low Tc abundances (as low as log ϵ (Tc) ∼ –1.3; see S stars in Fig. 4). Consequently, the Tc barycentre may also be sensitive to increases in the C/O ratio or [s/Fe], through s-process element blends affecting the Tc I lines.
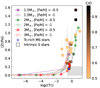 |
Fig. 4. Nucleosynthesis predictions for Tc and Zr abundances during successive TDU events, shown as circles along the model tracks. Measured abundances in Tc-rich S stars (filled squares) from Shetye et al. (2021), are colour-coded by C/O ratio. Blue crosses highlight the two Tc-rich MS stars (AA Cam and o1 Ori) in their sample. The grey box highlights the expected locus of Tc-rich M stars, where the Tc range reflects the detection threshold for Tc-rich classification (see Fig. 1). The upper limit of the Zr range corresponds to the dashed black line in Fig. 2 with [s/Fe] = 0.2, which separates M from S stars. |
5. Spectral band indices of TiO-ZrO
We calculated band-strength indices for the TiO and ZrO bands, denoted as BTiO and BZrO, respectively, for both observed and synthetic spectra. Details of the computation and on the continuum and band windows used for these indices are provided in Van Eck et al. (2017). In summary, we used four ZrO bands within the wavelength range of 5740–6530 Å and seven TiO bands between 5440 and 7150 Å. BTiO and BZrO were calculated for each molecular band using Equation (1) of Van Eck et al. (2017). The final index for each molecule was derived by averaging the values obtained from the individual bands.
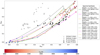 |
Fig. 2. Band strength indices, BTiO and BZrO, for Tc-rich and Tc-poor M stars from this study, and for Tc-rich (intrinsic) and Tc-poor (extrinsic) S stars from Shetye et al. (2021). These are represented by filled or open squares and triangles, as indicated in the legend. Corresponding spectral indices are also computed from synthetic spectra based on model atmospheres with varying stellar parameters, including effective temperature (colour-coded according to the colour bar), metallicity, C/O ratio, s-process enrichment [s/Fe], alpha-elements enrichment [α/Fe], and microturbulence, χt. Band strengths derived from synthetic spectra are shown as crosses, with models of [Fe/H] = 0 connected by dashed lines and those with [Fe/H] = –1 connected by solid lines. |
These spectral indices indicate that M stars generally exhibit significantly stronger TiO absorption bands than both Tc-poor and Tc-rich S stars, while their ZrO bands are comparable in depth to those of Tc-rich S stars. A comparison of Fig. 2 with Figs. 6 and 8 of Van Eck et al. (2017) demonstrates that M-, S-, and C-type stars occupy distinct locations in the BTiO–BZrO plane. In addition to temperature effects, this separation is driven by the strong dependence of ZrO and TiO band strengths on the C/O ratio: varying this ratio produces a clear displacement of the synthetic band indices within this diagram.
Within the S star sample, intrinsic S stars exhibit significantly stronger ZrO and TiO bands, likely owing to their cooler temperatures than those of extrinsic S stars. Similarly, among the M stars in the current study, a separation between Tc-rich and Tc-poor M stars is observed, albeit less clearly than for S stars. Interestingly, four Tc-poor M stars (V Cas, UV Her, R CVn, and R Leo) show ZrO band strengths comparable to those of Tc-rich M stars. These stars are highly variable, suggesting that they are cooler than other Tc-poor M stars, which could account for their enhanced ZrO and TiO band strengths.
To further investigate the dependence of the BTiO and BZrO indices on stellar parameters, we compared them with indices computed from synthetic spectra. Figure 2 shows the synthetic band indices as a function of varying effective temperature, metallicity, C/O ratio, [s/Fe]2, and microturbulence for the models used to compute the spectra. Models with Teff ≈ 4000 K produce BTiO ≈ BZrO ≈ 0, as expected for K giants with very weak molecular bands. The models that best reproduce the Tc-rich M star TiO and ZrO band strengths are [Fe/H] = −1 models. Agreement is also found for some stars for the [Fe/H] = 0 models with C/O ≤ 0.5, which is the range expected for M stars.
6. Stellar parameters and the HR diagram
6.1. Metallicity [Fe/H] derivation of OP Her and RX Lac
To estimate the metallicity of the sample stars, we conducted an abundance analysis on the two least variable Tc-rich M stars in our sample: OP Her (ΔV = 0.90 mag) and RX Lac (ΔV = 1.54 mag). Initial effective temperature estimates were obtained from the ZrO-TiO analysis (see Fig. 2). Using these estimates as a starting point, we compared the observed spectra of these stars with synthetic spectra generated at the same temperature. Synthetic spectra were produced using MARCS model atmospheres for S stars (Van Eck et al. 2017) and Turbospectrum (Plez 2012). We iteratively adjusted the C/O ratio and titanium abundance to optimise the agreement between the observed and synthetic spectra. A satisfactory match was defined as a good reproduction of key molecular bands, such as ZrO, TiO, and CN. Once this was achieved, we analysed six to 12 Fe lines to determine the metallicity of the two stars. The stellar parameters used for this analysis and the derived metallicities are presented in Table 1. The typical uncertainties in our derived parameters are ±100 K for the effective temperature, ±1 dex for surface gravity (log g), and ±0.25 for the C/O ratio (for more details on the typical uncertainties in evolved stars, see Shetye et al. 2018, 2021). The uncertainties in luminosity are listed in Table 1 and were calculated based on the errors in the Gaia Data Release (DR3) parallaxes. For comparison, we also included the stellar parameters and metallicity of AA Cam (an MS star with ΔV = 0.24 mag) from Shetye et al. (2021).
Stellar parameters and metallicity of selected sample stars.
Although based on a limited sample, there is evidence that the metallicities of Tc-rich M stars are subsolar, with [Fe/H] values of −0.3, −0.6, and −0.9 (see Table 1). The average metallicity derived for the three Tc-rich M (or MS) stars is slightly lower than that of the Tc-rich S star sample, which exhibits a [Fe/H] distribution peaking at −0.3 (Shetye et al. 2021). We note that the abundance analysis of the Tc-rich M stars in this sample is particularly challenging, as discussed in detail by Shetye et al. (2022). Consequently, a comprehensive abundance analysis of the full sample is deferred to a forthcoming paper.
6.2. Location of AA Cam, OP Her, and RX Lac in the HR diagram
A tentative mass estimate for some Tc-rich M stars can be obtained by placing them in the HR diagram (Fig. 3). However, their intrinsic variability in luminosity and effective temperature introduces significant uncertainties. This variability complicates the direct comparison of their locations in the HR diagram with STAREVOL evolutionary tracks (Siess et al. 2000). For the least variable Tc-rich M stars (for which we derived metallicities in the previous section - see Table 1), we calculated luminosities using the method outlined by Shetye et al. (2018, 2021). This approach uses parallaxes from Gaia DR3 (Gaia Collaboration 2023) and extinction values from the Gontcharov (2017) reddening map. These three Tc-rich M stars (namely AA Cam, OP Her, and RX Lac) are all located beyond the predicted onset of the TDU (indicated by the dashed black line in Fig. 3) and overlap with the region occupied by Tc-rich S stars. Thus, AGB stars do not strictly adhere to the canonical M-S-C evolutionary sequence in the HR diagram. Uttenthaler (2024) report a similar finding and observe comparable luminosity functions for Tc-rich M, MS, and S stars. This finding adds further complexity to understanding how these stars evolve.
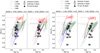 |
Fig. 3. Locations of the Tc-rich M stars AA Cam, OP Her, and RX Lac (filled triangles) in the HR diagram. The HR diagrams also include STAREVOL evolutionary tracks corresponding to the closest available metallicities ([Fe/H] = –0.5 or –1.0) with [O/Fe] = 0 and 0.4, hence AA Cam and OP Her appear in the left sub-panels, while RX Lac is shown in the right sub-panels. The dashed black line marks the predicted onset of the TDU, that is, the lowest stellar luminosity following the first occurrence of a TDU episode. For comparison, Tc-rich S stars (empty triangles) from Shetye et al. (2021) and Tc-poor S stars (empty squares) from Shetye et al. (2018) with metallicities around [Fe/H] = –0.5 are included. |
Because stars of metallicity [Fe/H] = –1 generally exhibit enhanced [O/Fe] by 0.4 dex, we also compared the positions of our Tc-rich M stars with oxygen-rich evolutionary tracks (see Sect. 7 for details of these models). However, these O-rich tracks do not favour Tc-rich M masses lower than those predicted by the standard tracks, even though masses as low as 1 M⊙ appear to be required by their kinematical properties, as concluded in Sect. 8.2 below.
From Fig. 3, the positions of the three Tc-rich M stars in the HR diagram are consistent with low-metallicity evolutionary tracks for masses between 1.5–2 M⊙, and possibly even as low as ∼1.0 M⊙, similar to what Shetye et al. 2019 report for the lowest-luminosity Tc-rich. The 3 M⊙ tracks can be ruled out.
7. Nucleosynthesis predictions
Stellar models with initial mass M = {1.5, 2, 3} M⊙ and metallicities [Fe/H] = {–0.5, –1} were computed with the STAREVOL code (Siess et al. 2000). Its main physical ingredients are as follows: the nuclear network includes 414 nuclei and 749 nuclear reactions (β− decay, n−, p−, α−, and electron captures) as described by Goriely & Siess (2018). Before the thermally pulsing AGB phase, we used the Schröder & Cuntz (2007) mass loss rate prescription and then adopted the maximum between Schröder & Cuntz (2007) and Vassiliadis & Wood (1993). We also considered core overshooting following the mass-dependence relation of Claret & Torres (2018). During the AGB phase, extra mixing below the convective envelope was modelled as in Goriely & Siess (2018), with the following mixing parameters: p = 5, Dmin = 109, and fover = 0.1. We used the solar composition of Asplund et al. (2009) and the mixing-length parameter αMLT = 1.75. For the O-rich models, we used the same solar-scale composition as before, except that [O/Fe] = 0.4. The excess mass fraction due to this enrichment was then deduced from the H mass fraction.
Figure 4 shows the predicted nucleosynthesis trends for the evolution of Tc and Zr abundances over successive thermal pulses and TDU events during the AGB phase. During the initial TDU events, the Tc abundance, traced via log ϵ (Tc)3, increases without observational effect on the Zr abundance.
A slight [Zr/Fe] enhancement emerges once log ϵ(Tc) reaches between –1.5 and –0.5, depending on the model. This delayed increase in Zr results from an existing non-zero (solar-scaled) Zr abundance: since [Zr/Fe] = log ϵ(Zr)−2.58−[Fe/H] (where log ϵ(Zr)⊙ = 2.58, Asplund et al. 2009), as long as the Tc increase ΔN(Tc) is of the order 10−6 to 10−2, the expected similar increase in ΔN(Zr) is not noticeable in[Zr/Fe]. Consequently, the spectral change at the location of the Tc line is readily noticeable, whereas the increase in the ZrO band depth is more progressive. This gradual increase in [Zr/Fe] contrasts with the more abrupt Tc increase from zero, providing a natural explanation for Tc-rich M stars.
Since no successful abundance analyses could be performed for Tc-rich M stars (see Sect. 3), the few stars plotted in Fig. 4 are Tc-rich S stars from Shetye et al. (2021), which include two Tc-rich MS4 stars (AA Cam and o1 Ori; blue crosses), which are much less variable than Tc-rich M stars and therefore easier to analyse.
The classification thresholds between Tc-poor and Tc-rich stars, and between M and S, define a narrow region in Fig. 4 where Tc-rich M stars are expected to lie. Based on the tests performed on synthetic spectra as summarised in Fig. 1, stars are typically identified as Tc-rich only when log ϵ(Tc) > − 0.5. Conversely, the transition from M to S occurs near [Zr/Fe] = 0.2 (see Fig. 6 of Shetye et al. 2021, as well as the black dashed line corresponding to the s-process index of 0.2 dex in Fig. 2). This small region is delineated by the grey rectangle in Fig. 4. Most of the nucleosynthesis models considered fall outside the Tc-rich M box. Only [Fe/H] = –0.5 models are marginally compatible with this Tc-rich M box. Whereas one of the Tc-rich stars, o1 Ori, lies in the grey region, the other, AA Cam, does not, as its Zr abundance is comparable to that of intrinsic S stars. However, since AA Cam was classified as M5S after its Zr enhancement was identified, it cannot be considered a genuine prototypical Tc-rich M star.
8. Spatial and kinematical properties
In this section, we compare the spatial and kinematical properties of Tc-rich and Tc-poor M stars to simulations from the Besançon Galactic model (Robin 2021), as well as to the observed properties of other populations of late-type stars. These include carbon N stars and Tc-rich or Tc-poor S stars (Abia et al. 2022) and the kinematically normal M giants defined by Famaey et al. (2005), i.e. M giants not belonging to any of the streams identified by those authors. We adopted the Bayesian distances provided by Bailer-Jones et al. (2021), which are based on a Bayesian analysis of Gaia EDR3 parallaxes. We excluded R Leo from the kinematical and spatial analysis as there is no Gaia DR3 parallax available for it.
Spatial and kinematical properties of the samples, roughly ordered from younger to older (according to σu), from left to right, excluding the data from the Besançon Galactic model.
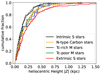 |
Fig. 5. Cumulative distribution of the height above the Galactic plane, |Z| (in kpc). The intrinsic and extrinsic S star samples are taken from Abia et al. (2022), as are the N-type carbon stars. The solid lines correspond to the observed distributions, and the dashed line to the fit corresponding to an exponentially decreasing spatial |Z| distribution. The meaning of the colours are given in the insert. |
Galactic scale heights are discussed in Sect. 8.1, followed by kinematics in Sect. 8.2, with a summary presented in Sect. 8.3.
8.1. Galactic scale heights
Figure 5 compares the heliocentric height above the Galactic plane, (|Z|), of these populations. There is a clear trend of increasing scale height, HZ (derived from the fit of an exponentially decreasing function exp(−|Z|/HZ) to the spatial density), in the sequence of Tc-rich S, Tc-rich M, Tc-poor M, N-type C, and Tc-poor S stars. The three middle populations (Tc-rich M, Tc-poor M and N-type C) being indistinguishable from each other. Their respective scale heights, HZ, are listed in the lower part of Table 2.
Their distribution across the Galactic plane suggests that Tc-rich and Tc-poor M stars belong to the same population (but see Sect. 8.2, where we argue that the scale height is less sensitive than kinematics). In contrast, both Tc-rich and Tc-poor M stars have a larger scale height than Tc-rich S stars, pointing to a younger (that is, more massive) population for the latter. In contrast, Tc-poor S stars are the most dispersed across the Galactic midplane, with the largest scale height (260 pc) of all the samples considered here. This value is comparable to the ∼320 pc found by Shetye et al. (2021), indicating that this population is the oldest among those considered here. This conclusion is not surprising, as Tc-poor S stars (also known as extrinsic S stars) host a white dwarf companion. However, not all of these conclusions are confirmed by the kinematical analysis presented in Sect. 8.2.
8.2. Kinematics
The kinematical properties of the samples listed in Table 2 refer to the heliocentric velocities (u, v, w) in the Galactic coordinate system, defined as
 (1)
(1)
where VR, Vp, and VZ are the stellar velocities in the Galactocentric reference frame (as given by Abia et al. 2022, for the N, extrinsic S and intrinsic S stars); VLSR (240 km/s, as adopted by Abia et al. 2022, from Reid & Honma 2014) is the velocity of the local standard of rest (LSR) in the direction of Galactic rotation; and U⊙, V⊙, and W⊙ are the components of solar motion in the LSR (11.1, 12.2, 7.2 km/s respectively, as adopted by Abia et al. 2022, from Schönrich 2012). The conversion from the VR, Vp, and VZ values given by Abia et al. (2022) to the u, v, and w values listed in Table 2 was carried out with Eqs. (1) and the kinematical constants listed above. In the present paper, the u, v, and w velocities were computed from radial velocities, proper motions, and parallaxes from Gaia DR3 (Gaia Collaboration 2023). When Gaia DR3 radial velocities were unavailable, we used values derived from their HERMES spectra using the cross-correlation method (Raskin et al. 2011), corrected from the barycentric velocity. The uncertainties on σu, σv and σw listed in Table 2 were estimated using a Monte Carlo method, sampling the error distributions in radial velocity, parallax, and proper motion.
The property σu > σv > σw should be satisfied by the kinematic quantities listed in Table 2 (e.g., Binney & Merrifield 2021). This indeed appears to be the case, providing a useful sanity check of the data, especially given that the binarity of Tc-poor S stars may affect the evaluation of their velocity dispersions5.
As inferred above from their spatial properties, the kinematics of Tc-poor M stars indicates that they are older than Tc-rich S stars, which appear to be the youngest (that is, most massive) population among the three discussed so far. However, Tc-rich M stars now appear to be much older than both Tc-poor M stars and Tc-poor S stars. Moreover, from a kinematical viewpoint, Tc-rich and Tc-poor M stars are no longer equivalent, in contrast to what was inferred from their identical scale heights. Kinematical properties therefore offer a more sensitive diagnostic probe than the scale height. M stars that are Tc-poor M stars also appear slightly older than the kinematical reference sample of M giants from Famaey et al. (2005).
A comparison with the predictions of the Besançon Galactic model (Robin 2021), listed in the right-hand part of Table 2, allows a more quantitative association of ages with the various populations under consideration. This comparison reveals that Tc-rich M stars have kinematical properties similar to the oldest stars in the thin disc, aged from 7–10 Gyr, corresponding to the main-sequence lifetimes of 1–1.15 M⊙ solar-metallicity stars. STAREVOL models were used to evaluate the ages appropriate for evolved low-metallicity AGB stars (−0.9 ≤ [Fe/H] ≤ − 0.3; see Table 1), which Tc-rich M giants are presumed to be. The kinematics of Tc-rich M stars are only marginally compatible with stars aged ∼7 Gyr (Table 2), that is, low-metallicity ([Fe/H] = –1) AGB stars with initial masses of about 1.0 M⊙. As shown in Table 2, in no case could the kinematics of Tc-rich M stars be reconciled with low-metallicity progenitors of either 2 or 1.5 M⊙ initial masses, which would require ages of only 1–2 Gyr, respectively, to reach the AGB.
8.3. Summary
The conclusions that emerge from the spatial and kinematical properties of the various samples studies are not clear-cut, since they are not always consistent with each other. For instance, the Galactic scale heights suggest that Tc-rich and Tc-poor M stars belong to the same population, whereas the kinematics suggests that Tc-rich M stars are older than Tc-poor M stars. The kinematics also suggest that Tc-rich M stars are older than Tc-poor S stars, whereas Galactic scale heights suggest the opposite. The kinematics suggest that Tc-rich M stars constitute the oldest population among the three, whereas the Galactic scale heights would instead indicate that the population of Tc-poor S stars is the oldest.
If the kinematics of Tc-rich M stars can be trusted, they imply ages of up to 7 Gyr, corresponding to low-metallicity progenitors with initial masses as low as 1 M⊙, and excluding progenitors with initial masses of 2 M⊙.
9. Discussion
From the previous sections, the following consistent picture emerges concerning Tc-rich M stars:
-
From the abundance analysis (Sect. 6.1 and Table 1), Tc-rich M stars cover a metallicity range −0.9 ≤ [Fe/H] ≤ − 0.3. Although this is based only on the three least-variable stars for which an abundance analysis could be performed, it suggests that Tc-rich M stars have subsolar metallicities.
-
From their predicted Tc and Zr abundances (grey box in Fig. 4), Tc-rich M stars are marginally compatible with stellar-evolution and nucleosynthesis models corresponding to initial masses of 1.5–3 M⊙ at metallicity [Fe/H] = –0.5.
-
From their TiO and ZrO band depths and the BTiO–BZrO plane (Fig. 2), the best-fitting synthetic spectra for M stars with the strongest ZrO and TiO absorption correspond to the lowest metallicity models ([Fe/H] = –1 dex). This effect may be attributed to α-element enrichment, which is anti-correlated with metallicity, allowing only the lowest-metallicity synthesis to reproduce the highest BTiO values. However, some Tc-rich M stars are also found along the solar-metallicity tracks.
-
In the HR diagram (Sect. 6.2), the location of Tc-rich M stars is compatible with stars of masses ∼1.5 M⊙, amidst Tc-rich S stars.
-
The distribution of Tc-poor and Tc-rich M stars above the Galactic plane is similar (190 pc), and is also close to that of the ‘background’6 M giants studied by Famaey et al. (2005). Technetium-rich M stars appear to have a scale height above the galactic plane intermediate between that of Tc-rich S stars (150 pc) and Tc-poor S stars (260 pc). This conclusion may seem at variance with their respective locations in the HR diagram of Fig. 3, where the mass range spanned by Tc-rich S stars overlaps that of Tc-rich M stars, while also being much more extended. We stress, however, that this almost certainly arises from the small sample size used in Fig. 3, whereas the scale height obtained from Fig. 5 is derived from a much larger sample that is less prone to statisticalbiases.
-
The velocity dispersions σu, σv, σw of Tc-rich M stars indicate a particularly old population, with ages up to 7–10 Gyr (Table 2). This is not observed for other subgroups of M giants, indicating that the older age appears to be a distinctive property of Tc-rich M giants. The reason for this old age is, however, not easily identified. Giants with masses of the order of 1.0 M⊙ match the requirement of a 10-Gyr age. However, a well-known limitation of current nucleosynthesis models is their failure to trigger TDU at such low masses, at least when using standard prescriptions for mixing processes. Nevertheless, observational evidence of s-process enrichment exists in stars with initial masses near 1.0 M⊙, such as Tc-rich S stars reported by Shetye et al. (2019) and low-mass, s-process-enhanced post-AGB stars identified by De Smedt et al. (2015) and Kamath et al. (2022). The other subgroups of M giants, which do not face the constraint of s-process nucleosynthesis followed by TDUs, could populate the giant branch instead of the AGB. Hence, their masses could span the range 1–2 M⊙, resulting in an average age much lower than that of Tc-rich M stars. Why AGB stars with masses as high as 2 M⊙ do not evolve into Tc-rich M stars, despite their predicted passage through the Tc-rich M locus (grey box in Fig. 4), has not, however, been elucidated.
-
The kinematics confirm the conclusion from the Galactic scale heights that Tc-rich M stars are an older population than Tc-rich S stars.
All these elements converge towards a scenario in which Tc-rich M stars are subsolar-metallicity AGB stars with masses as low as 1 M⊙, whereas Tc-rich S stars would be slightly more massive on average, based on their hotter kinematics and smaller Galactic scale height.
The only clear difference with Tc-rich S stars is their enhanced TiO bands. The reason for these enhanced TiO bands is not currently clear; they might result from a larger O abundance or from a cooler temperature. This latter hypothesis is not confirmed by the HR diagram. However, we cannot exclude the possibility that these stars have cool starspots covering a significant fraction of their surface. Since these spots are cooler, they would contribute to stronger TiO features. Such spots could be related to the larger photometric variability of Tc-rich M stars, as photometric variability increases with increasing TiO and ZrO bands (see Fig. A.1).
Lastly, the classification of S and M stars is traditionally based on ZrO and TiO band strengths, with M stars expected to show only TiO bands, while the S stars are expected to show both ZrO and TiO bands. However, Fig. 2 shows that Tc-rich M stars also exhibit high BZrO and BTiO indices, with some Tc-poor M stars populating the same region. While the elevated BZrO in Tc-rich M stars may be due to a slight Zr enhancement (at most [Zr/Fe] ∼ 0.2 dex according to Fig. 2), the high BZrO in some Tc-poor M stars is unexpected. The Tc-poor M stars with high BZrO and BTiO indices also exhibit strong variability (Fig. A.1). Furthermore, band indices derived from the synthetic spectra (Fig. 2) indicate that the BZrO and BTiO plane is highly sensitive to temperature. This suggests that the highly variable and cool Tc-rich and Tc-poor M stars could be misclassified as M, as the relative band strengths of ZrO-TiO are strongly affected by temperature.
10. Conclusion
In this study, we performed a detailed analysis of a large sample of 39 M stars using high-resolution HERMES spectra. These stars were identified thanks to the growing availability of high-resolution spectra, which enable analysis of the weak blue Tc I lines. In contrast, earlier spectral classifications of M and S stars relied solely on TiO and ZrO bands, which are readily visible in low-resolution spectra.
We confirmed the Tc-rich nature of 18 M stars, whereas 21 M stars in our sample were identified as Tc-poor. We investigated, in nucleosynthesis models, the evolution of Zr and Tc abundances pulse-by-pulse during the thermally pulsing AGB phase. Our models show that significant Zr enrichment emerges only at log ϵ (Tc) values between –2 and 0. Furthermore, our spectral synthesis modelling shows that the detection threshold for classifying an M star as Tc-rich is log ϵ (Tc) = –0.5. At log ϵ (Tc) = –2 to 0 (Fig. 4), the nucleosynthesis predictions indicate only a mild enhancement in [Zr/Fe] of up to ∼0.2 dex. These findings suggest that some M stars can exhibit clear Tc absorption features without significantly strong ZrO bands. A comparison of the measured and synthetic spectral indices (Fig. 2) demonstrates that the BZrO index from synthetic spectra can encompass the regions occupied by Tc-rich M stars, even when the s-process enrichment is relatively mild, with [s/Fe] between 0 and 0.2 dex.
The spectral indices of M stars exhibit several intriguing characteristics: while their Tc features closely resemble those of S stars, they follow a distinct sequence in the BTiO – BZrO plane. Analysis of these spectral band indices suggests that Tc-rich M stars may have slightly lower metallicities than Tc-rich S stars. To test this hypothesis, we determined the metallicity of three Tc-rich M stars, finding values between –0.3 and –0.9 (see Table 1 and Sect. 6.1). These results indicate that low metallicity, and its influence on s-process nucleosynthesis, could contribute to the presence of Tc in these stars. Furthermore, by comparing the spatial and kinematical properties of our sample with those of intrinsic and extrinsic S stars, as well as N-type carbon stars, we find that Tc-rich and Tc-poor M stars belong to the same population, with Tc-rich stars having undergone TDU. Technetium-rich M stars may also be older than Tc-rich S stars, further supporting a metallicity distribution that is slightly shifted toward lower values compared to that of Tc-rich S stars.
Although the origin of the enhanced TiO bands is not fully understood, it likely explains the existence of Tc-rich M stars. These stars have been classified as M rather than S precisely because of their prominent TiO absorption features. If their TiO bands were weaker, given that their ZrO band strengths are comparable to those of S stars, they might instead have been classified as Tc-rich S stars. Thus, their existence may simply reflect a classification bias.
HERMES is an acronym for High Efficiency and Resolution Mercator Echelle Spectrograph.
Logarithmic abundance ratio of s-process elements to iron, relative to the solar ratio; quantifies the enrichment of s-process elements (typically in the range Z = 31 to Z = 83) compared with iron.
The logarithmic abundance of technetium, denoted as log ϵ (Tc), is defined as
where NTc and NH are the number densities of technetium and hydrogen atoms, respectively. The constant 12 is a normalisation factor that sets the abundance of hydrogen to log ϵ(H) = 12.00 by definition.
MS stars are stars sharing the distinctive spectral properties of M stars (TiO bands) and S stars (ZrO bands).
The standard deviations σu, σv, and σw reported by Abia et al. (2022) do not take the centre-of-mass velocity into consideration, but instead use a velocity randomly selected from the velocity curve depending on the epoch of observation. Adopting a typical semi-amplitude K of 7 km/s for the S-star velocity curves (Jorissen et al. 2019), one may estimate the uncertainty introduced by computing σu, σv, and σw from a randomly sampled velocity on the velocity curve instead of from the centre-of-mass velocity. This uncertainty is of the order σ − (σ2 − K2)1/2, i.e. 1.5 km/s for σ = 15.2 km/s, or 0.9 km/s for σ = 27.4 km/s, and is therefore negligible.
As opposed to M giants involved in specific stellar streams, as described by Famaey et al. (2005).
Acknowledgments
SS would like to acknowledge the support of Research Foundation-Flanders (grant number: 1239522N). AE received the support of a fellowship from “La Caixa” Foundation (ID 100010434) with fellowship code LCF/BQ/PI23/11970031. SG and LS acknowledge financial support from F.R.S.-FNRS (Belgium). SU acknowledges the support from the Austrian Science Fund (10.55776/F81). Based on observations made with the Mercator Telescope, operated on the island of La Palma by the Flemish Community, at the Spanish Observatorio del Roque de los Muchachos of the Instituto de Astrofísica de Canarias. The IRI number for Mercator operations is I000325N. This work has made use of data from the European Space Agency (ESA) mission Gaia (https://www.cosmos.esa.int/gaia). For open access purposes, the author has applied a CC BY public copyright license to any author accepted manuscript version arising from this submission.
References
- Abia, C., de Laverny, P., Romero-Gómez, M., & Figueras, F. 2022, A&A, 664, A45 [NASA ADS] [CrossRef] [EDP Sciences] [Google Scholar]
- Alvarez, R., & Plez, B. 1998, A&A, 330, 1109 [NASA ADS] [Google Scholar]
- Asplund, M., Grevesse, N., Sauval, A. J., & Scott, P. 2009, ARA&A, 47, 481 [NASA ADS] [CrossRef] [Google Scholar]
- Bailer-Jones, C. A. L., Rybizki, J., Fouesneau, M., Demleitner, M., & Andrae, R. 2021, VizieR On-line Data Catalog: I/352 [Google Scholar]
- Binney, J., & Merrifield, M. 2021, Galactic Astronomy (Princeton University Press) [Google Scholar]
- Claret, A., & Torres, G. 2018, ApJ, 859, 100 [Google Scholar]
- De Smedt, K., Van Winckel, H., Kamath, D., & Wood, P. R. 2015, A&A, 583, A56 [NASA ADS] [CrossRef] [EDP Sciences] [Google Scholar]
- Ducati, J. R. 2002, VizieR Online Data Catalog: Catalogue of Stellar Photometry in Johnson’s 11-color system [Google Scholar]
- Famaey, B., Jorissen, A., Luri, X., et al. 2005, A&A, 430, 165 [CrossRef] [EDP Sciences] [Google Scholar]
- Gaia Collaboration (Vallenari, A., et al.) 2023, A&A, 674, A1 [NASA ADS] [CrossRef] [EDP Sciences] [Google Scholar]
- Gontcharov, G. A. 2017, Astron. Lett., 43, 472 [NASA ADS] [CrossRef] [Google Scholar]
- Goriely, S., & Siess, L. 2018, A&A, 609, A29 [NASA ADS] [CrossRef] [EDP Sciences] [Google Scholar]
- Jorissen, A., Frayer, D. T., Johnson, H. R., Mayor, M., & Smith, V. V. 1993, A&A, 271, 463 [NASA ADS] [Google Scholar]
- Jorissen, A., Boffin, H. M. J., Karinkuzhi, D., et al. 2019, A&A, 626, A127 [NASA ADS] [CrossRef] [EDP Sciences] [Google Scholar]
- Kamath, D., Van Winckel, H., Ventura, P., et al. 2022, ApJ, 927, L13 [NASA ADS] [CrossRef] [Google Scholar]
- Lebzelter, T., & Hron, J. 1999, A&A, 351, 533 [NASA ADS] [Google Scholar]
- Lebzelter, T., & Hron, J. 2003, A&A, 411, 533 [NASA ADS] [CrossRef] [EDP Sciences] [Google Scholar]
- Little, S. J., Little-Marenin, I. R., Hagen, W., & Lewis, L. 1986, Bull. Am. Astron. Soc., 18, 669 [Google Scholar]
- Little, S. J., Little-Marenin, I. R., & Bauer, W. H. 1987, AJ, 94, 981 [NASA ADS] [CrossRef] [Google Scholar]
- Little-Marenin, I. R., & Little, S. J. 1979, AJ, 84, 1374 [Google Scholar]
- Maehara, H. 2014, JAXA Research and Development Report, 3, 119 [Google Scholar]
- Merrill, P. W. 1952, ApJ, 116, 21 [NASA ADS] [CrossRef] [Google Scholar]
- Plez, B. 2012, Astrophysics Source Code Library [record ascl:1205.004] [Google Scholar]
- Raskin, G., van Winckel, H., Hensberge, H., et al. 2011, A&A, 526, A69 [CrossRef] [EDP Sciences] [Google Scholar]
- Reid, M. J., & Honma, M. 2014, ARA&A, 52, 339 [NASA ADS] [CrossRef] [Google Scholar]
- Robin, A. 2021, Gaia Early Data Release 3 Documentation, Sect. 2.2.2 (https://gea.esac.esa.int/archive/documentation/GEDR3) (ESA& Gaia Data Processing and Analysis Consortium) [Google Scholar]
- Schönrich, R. 2012, MNRAS, 427, 274 [Google Scholar]
- Schröder, K. P., & Cuntz, M. 2007, A&A, 465, 593 [NASA ADS] [CrossRef] [EDP Sciences] [Google Scholar]
- Shetye, S., Van Eck, S., Jorissen, A., et al. 2018, A&A, 620, A148 [NASA ADS] [CrossRef] [EDP Sciences] [Google Scholar]
- Shetye, S., Goriely, S., Siess, L., et al. 2019, A&A, 625, L1 [NASA ADS] [CrossRef] [EDP Sciences] [Google Scholar]
- Shetye, S., Van Eck, S., Jorissen, A., et al. 2021, A&A, 650, A118 [NASA ADS] [CrossRef] [EDP Sciences] [Google Scholar]
- Shetye, S., Van Eck, S., Jorissen, A., Siess, L., & Goriely, S. 2022, in The Origin of Outflows in Evolved Stars, eds. L. Decin, A. Zijlstra, & C. Gielen, IAU Symp., 366, 259 [Google Scholar]
- Siess, L., Dufour, E., & Forestini, M. 2000, A&A, 358, 593 [Google Scholar]
- Smith, V. V., & Lambert, D. L. 1988, ApJ, 333, 219 [NASA ADS] [CrossRef] [Google Scholar]
- Uttenthaler, S. 2024, A&A, 692, A224 [NASA ADS] [CrossRef] [EDP Sciences] [Google Scholar]
- Uttenthaler, S., van Stiphout, K., Voet, K., et al. 2011, A&A, 531, A88 [NASA ADS] [CrossRef] [EDP Sciences] [Google Scholar]
- Van Eck, S., & Jorissen, A. 1999, A&A, 345, 127 [NASA ADS] [Google Scholar]
- Van Eck, S., Neyskens, P., Jorissen, A., et al. 2017, A&A, 601, A10 [NASA ADS] [CrossRef] [EDP Sciences] [Google Scholar]
- Van Eck, S., Shetye, S., & Siess, L. 2022, Universe, 8, 220 [NASA ADS] [CrossRef] [Google Scholar]
- Vanture, A. D., Wallerstein, G., Brown, J. A., & Bazan, G. 1991, ApJ, 381, 278 [NASA ADS] [CrossRef] [Google Scholar]
- Vassiliadis, E., & Wood, P. R. 1993, ApJ, 413, 641 [Google Scholar]
Appendix A: Variability and Molecular Band Strengths
Figure A.1 shows the measured BTiO and BZrO indices for the sample M stars, color-coded by their variability amplitude (ΔV) as listed in Table B.1. This visualization allows for an assessment of whether stellar variability correlates with the strength of TiO and ZrO molecular bands. Please note that only the variability of our sample M stars have been included here because this information was not available for the majority of the S stars from Shetye et al. (2021).
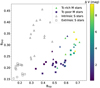 |
Fig. A.1. The measured BTiO and BZrO, same as Figure 2. The sample M stars are color coded with respect to their ΔV listed in Table B.1. |
Appendix B: Basic data of the sample stars
In this section, we provide an overview of the fundamental and spectral properties of the sample stars. In Table B.1, the basic properties are summarized along with the sample classification into Tc-rich and Tc-poor groups. In Tables B.2, the spectra indices computed in Sect. 5 are enlisted for the M stars sample, while in Table B.3 the same for the S stars from our previous work are listed. Finally, in Figs. B.1, B.2, B.3 and B.4 the Tc features for the sample stars are presented.
Basic data of our M star sample.
Spectral indices of the M stars sample.
Spectral indices of the S stars from Shetye et al. (2018) and Shetye et al. (2021).
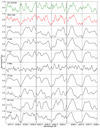 |
Fig. B.1. The spectral region around the three (4238.19, 4262.27 and 4297.06 Å) Tc I resonance lines in our sample of Tc-rich M stars. For comparison purposes, the spectrum of a Tc-poor S star (HD 233158, in green in the top panels) from S18 and a Tc-rich S star (V812 Oph, in red) from S21 are also plotted. The spectra have been arbitrarily normalized and smoothed using a Gaussian filter with a standard deviation (sigma) of 1Å to slightly increase the S/N ratio. |
All Tables
Spatial and kinematical properties of the samples, roughly ordered from younger to older (according to σu), from left to right, excluding the data from the Besançon Galactic model.
Spectral indices of the S stars from Shetye et al. (2018) and Shetye et al. (2021).
All Figures
|
Fig. 1. Central wavelengths of the Tc I blends at λ4238 and λ4262 Tc I. The dashed grey lines delineate the boundaries between the Tc-poor zone (upper left rectangle) and the Tc-rich region (lower-right rectangle, Van Eck & Jorissen 1999). Observed data points are shown as squares and triangles, corresponding to measurements of (λ4238, λ4262) in spectra of Tc-rich and Tc-poor M and S stars, as labelled. Synthetic spectra were generated for two effective temperatures (Teff = 2800 K and 4000 K), two metallicities ([Fe/H] = 0.0 and –0.5), two microturbulence velocities (χt = 2 and 3 km/s), and a range of Tc abundances (as indicated by the colour scale on the side). From these synthetic spectra, the central wavelengths of the λ4238 and λ4262 Tc I blends were measured. The results are represented as coloured circles, connected by lines that group models with the same atmospheric parameters, as indicated by the labels. |
| In the text | |
|
Fig. 4. Nucleosynthesis predictions for Tc and Zr abundances during successive TDU events, shown as circles along the model tracks. Measured abundances in Tc-rich S stars (filled squares) from Shetye et al. (2021), are colour-coded by C/O ratio. Blue crosses highlight the two Tc-rich MS stars (AA Cam and o1 Ori) in their sample. The grey box highlights the expected locus of Tc-rich M stars, where the Tc range reflects the detection threshold for Tc-rich classification (see Fig. 1). The upper limit of the Zr range corresponds to the dashed black line in Fig. 2 with [s/Fe] = 0.2, which separates M from S stars. |
| In the text | |
|
Fig. 2. Band strength indices, BTiO and BZrO, for Tc-rich and Tc-poor M stars from this study, and for Tc-rich (intrinsic) and Tc-poor (extrinsic) S stars from Shetye et al. (2021). These are represented by filled or open squares and triangles, as indicated in the legend. Corresponding spectral indices are also computed from synthetic spectra based on model atmospheres with varying stellar parameters, including effective temperature (colour-coded according to the colour bar), metallicity, C/O ratio, s-process enrichment [s/Fe], alpha-elements enrichment [α/Fe], and microturbulence, χt. Band strengths derived from synthetic spectra are shown as crosses, with models of [Fe/H] = 0 connected by dashed lines and those with [Fe/H] = –1 connected by solid lines. |
| In the text | |
|
Fig. 3. Locations of the Tc-rich M stars AA Cam, OP Her, and RX Lac (filled triangles) in the HR diagram. The HR diagrams also include STAREVOL evolutionary tracks corresponding to the closest available metallicities ([Fe/H] = –0.5 or –1.0) with [O/Fe] = 0 and 0.4, hence AA Cam and OP Her appear in the left sub-panels, while RX Lac is shown in the right sub-panels. The dashed black line marks the predicted onset of the TDU, that is, the lowest stellar luminosity following the first occurrence of a TDU episode. For comparison, Tc-rich S stars (empty triangles) from Shetye et al. (2021) and Tc-poor S stars (empty squares) from Shetye et al. (2018) with metallicities around [Fe/H] = –0.5 are included. |
| In the text | |
|
Fig. 5. Cumulative distribution of the height above the Galactic plane, |Z| (in kpc). The intrinsic and extrinsic S star samples are taken from Abia et al. (2022), as are the N-type carbon stars. The solid lines correspond to the observed distributions, and the dashed line to the fit corresponding to an exponentially decreasing spatial |Z| distribution. The meaning of the colours are given in the insert. |
| In the text | |
|
Fig. A.1. The measured BTiO and BZrO, same as Figure 2. The sample M stars are color coded with respect to their ΔV listed in Table B.1. |
| In the text | |
|
Fig. B.1. The spectral region around the three (4238.19, 4262.27 and 4297.06 Å) Tc I resonance lines in our sample of Tc-rich M stars. For comparison purposes, the spectrum of a Tc-poor S star (HD 233158, in green in the top panels) from S18 and a Tc-rich S star (V812 Oph, in red) from S21 are also plotted. The spectra have been arbitrarily normalized and smoothed using a Gaussian filter with a standard deviation (sigma) of 1Å to slightly increase the S/N ratio. |
| In the text | |
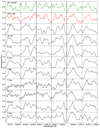 |
Fig. B.2. Same as Fig. B.1 for the remaining Tc-rich M stars in our sample. |
| In the text | |
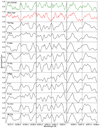 |
Fig. B.3. Same as Fig. B.1 for the Tc-poor M stars in our sample. |
| In the text | |
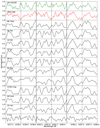 |
Fig. B.4. Same as Fig. B.1 for the Tc-poor M stars in our sample. |
| In the text | |
Current usage metrics show cumulative count of Article Views (full-text article views including HTML views, PDF and ePub downloads, according to the available data) and Abstracts Views on Vision4Press platform.
Data correspond to usage on the plateform after 2015. The current usage metrics is available 48-96 hours after online publication and is updated daily on week days.
Initial download of the metrics may take a while.