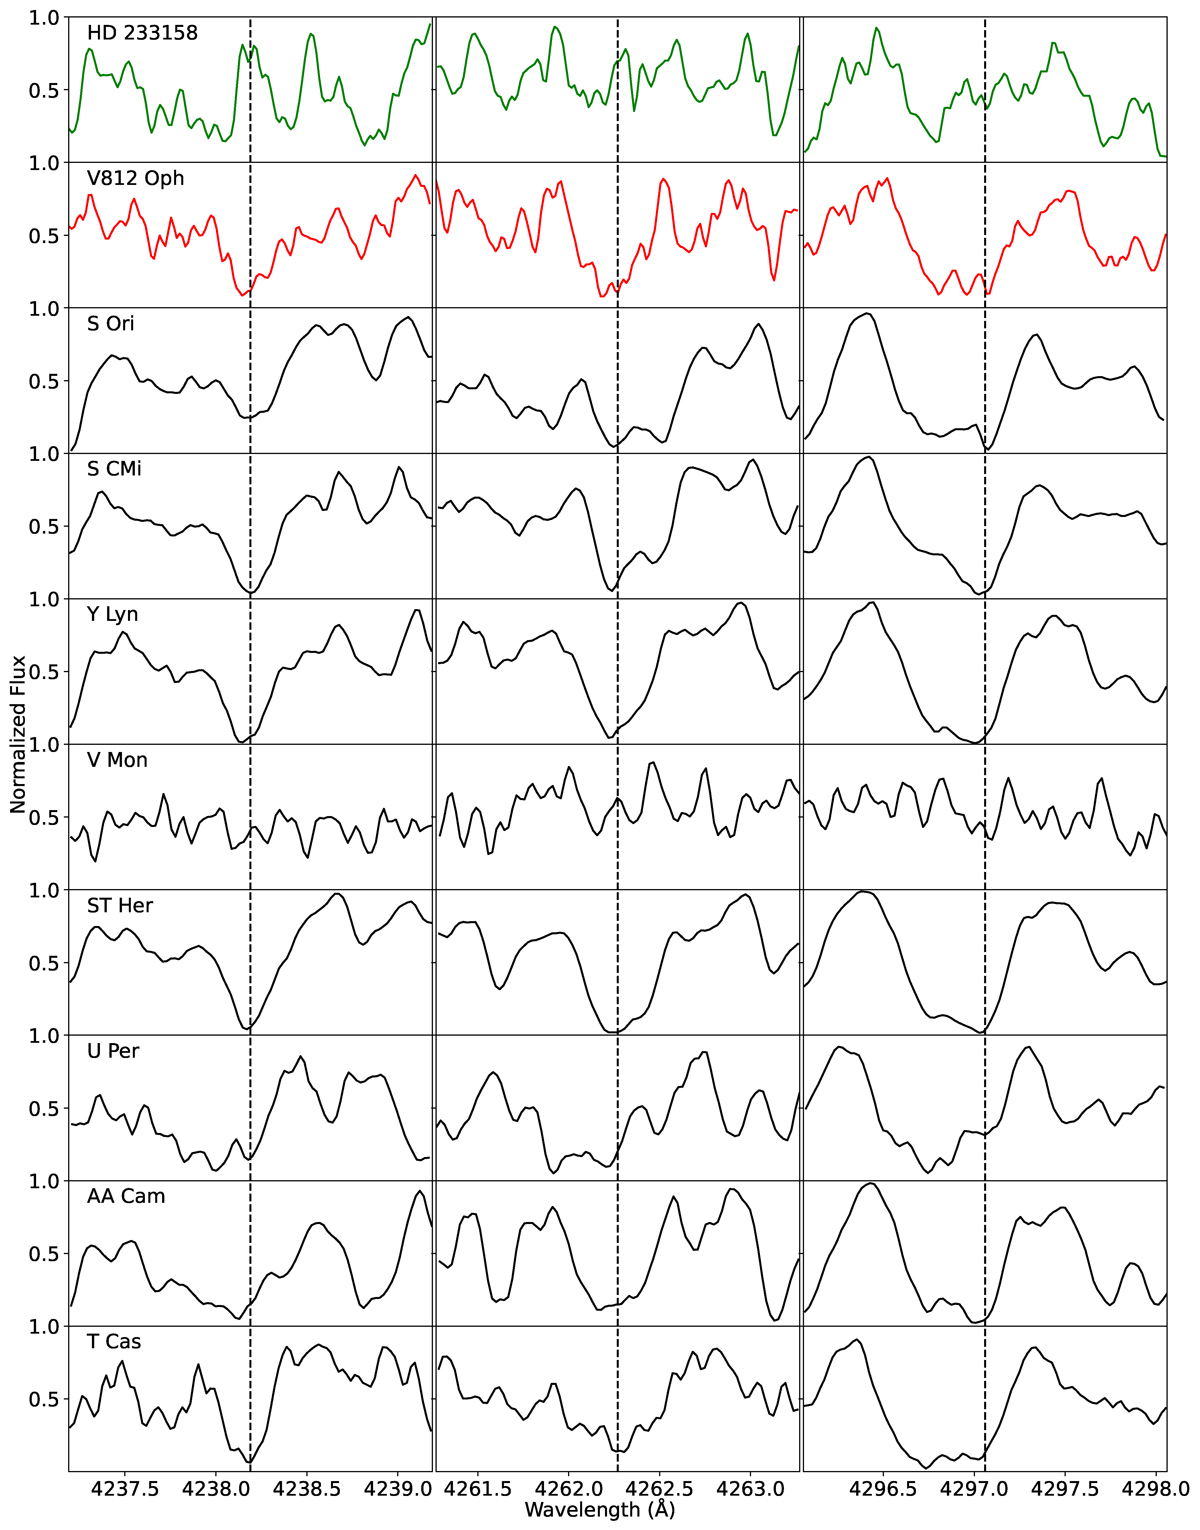
Fig. B.1.
Download original image
The spectral region around the three (4238.19, 4262.27 and 4297.06 Å) Tc I resonance lines in our sample of Tc-rich M stars. For comparison purposes, the spectrum of a Tc-poor S star (HD 233158, in green in the top panels) from S18 and a Tc-rich S star (V812 Oph, in red) from S21 are also plotted. The spectra have been arbitrarily normalized and smoothed using a Gaussian filter with a standard deviation (sigma) of 1Å to slightly increase the S/N ratio.
Current usage metrics show cumulative count of Article Views (full-text article views including HTML views, PDF and ePub downloads, according to the available data) and Abstracts Views on Vision4Press platform.
Data correspond to usage on the plateform after 2015. The current usage metrics is available 48-96 hours after online publication and is updated daily on week days.
Initial download of the metrics may take a while.