Fig. 3.
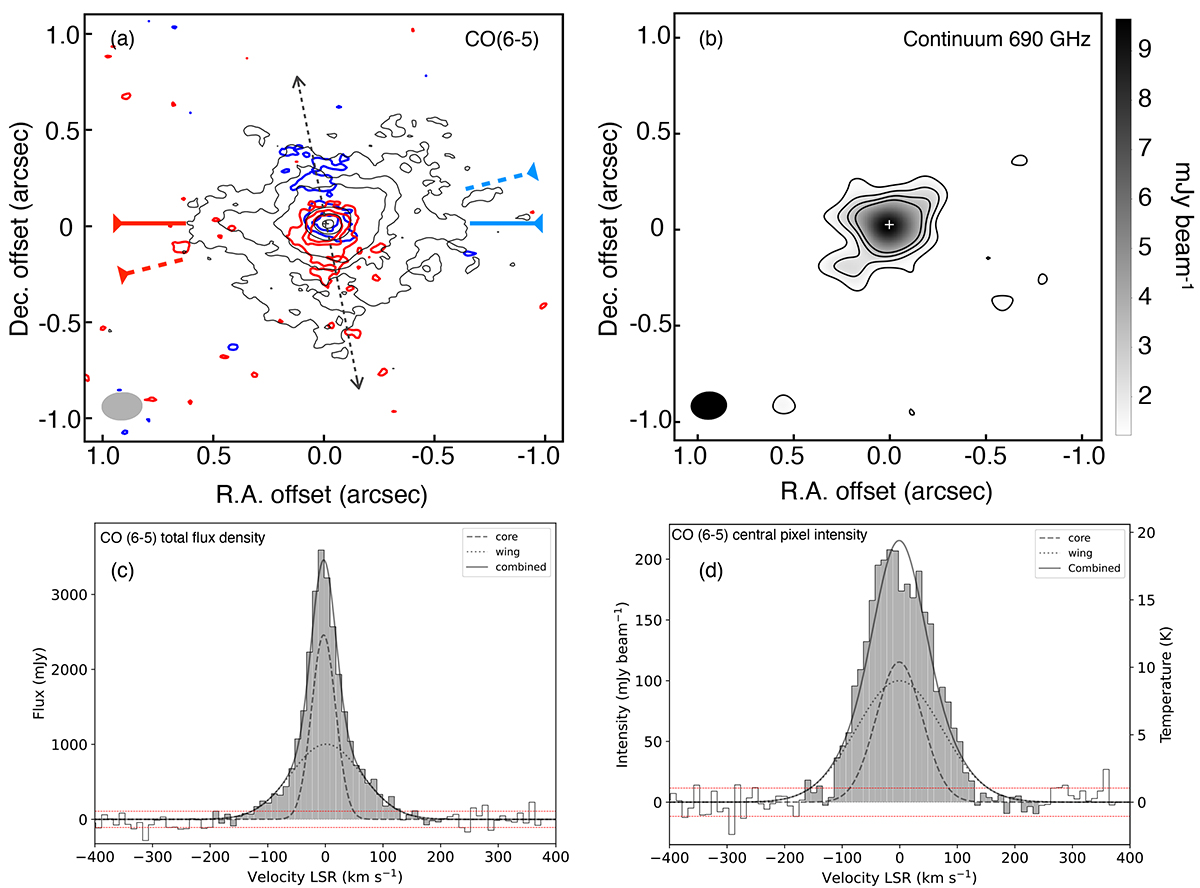
Download original image
Results of 691 GHz observations towards NGC 1377. (a) The velocity-integrated line emission maps of CO 6−5. Black contours: −70 km s−1 to 70 km s−1 (3, 6, 9, 27, and 36σ, where σcore = 0.29 Jy beam−1 km s−1); blue: −200 km s−1 to −100 km s−1; red: 100 km s−1 to 200 km s−1 (3, 6, 9, and 12σ, where σred = 0.13 Jy beam−1 km s−1 and σblue = 0.16 Jy beam−1 km s−1, respectively). The lines and symbol conventions are the same as in Fig. 1. (b) The continuum emission at 691 GHz in greyscale and contours: (3, 5, 7, and 9σ, where σcont = 4.07 × 10⁻¹ Jy beam−1). (c) Spectrum in the unit of the flux density within the emitting region (over 3σ in moment-0 image) against the line-velocity offset at the systemic velocity. The black histogram shows the observation result. The red dotted line indicates the 1σ rms level. The black dashed line shows the narrow line component, the dotted line shows the broad line component, and the solid line represents the two components combined. (d) Spectrum in units of the mean brightness at the peak intensity pixel against the line velocity.
Current usage metrics show cumulative count of Article Views (full-text article views including HTML views, PDF and ePub downloads, according to the available data) and Abstracts Views on Vision4Press platform.
Data correspond to usage on the plateform after 2015. The current usage metrics is available 48-96 hours after online publication and is updated daily on week days.
Initial download of the metrics may take a while.