Fig. 4.
Download original image
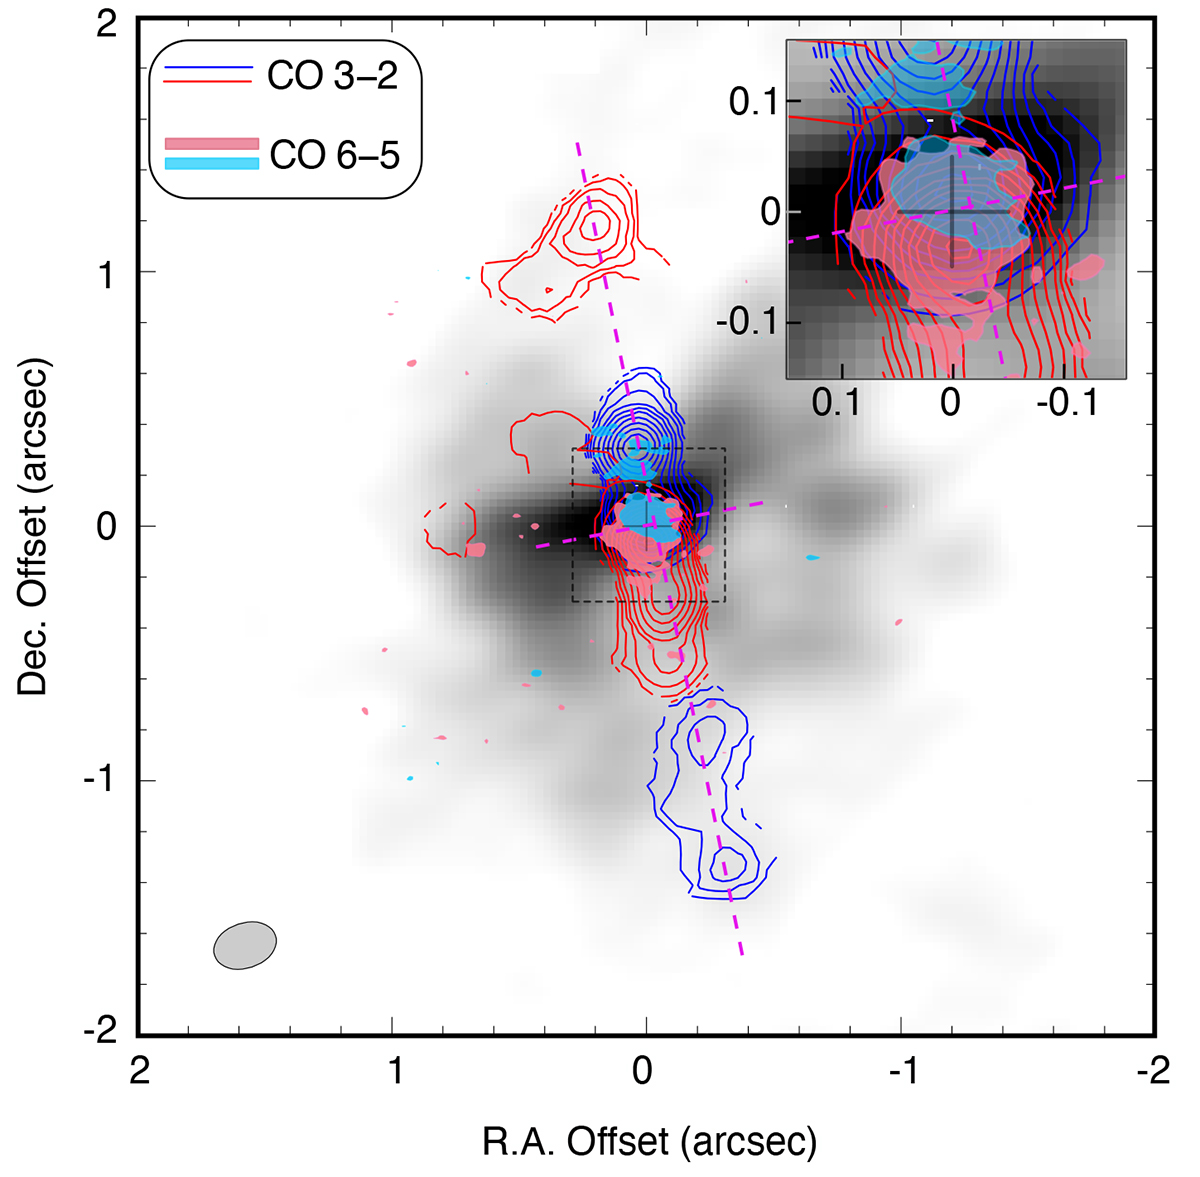
Velocity-integrated map of CO 3−2 (Aalto et al. 2016). Greyscale shows the emission close to systemic velocity. The high-velocity emission from the molecular jet is shown in contours (with the red and blue showing velocity reversals along the axis). The vertical bar indicates a scale of 100 pc. For details of the figure, see Aalto et al. (2016). We indicate the extent and orientation of the CO 6−5 high velocity gas (from Fig. 3) with light blue and yellow ovals.
Current usage metrics show cumulative count of Article Views (full-text article views including HTML views, PDF and ePub downloads, according to the available data) and Abstracts Views on Vision4Press platform.
Data correspond to usage on the plateform after 2015. The current usage metrics is available 48-96 hours after online publication and is updated daily on week days.
Initial download of the metrics may take a while.