Fig. 1.
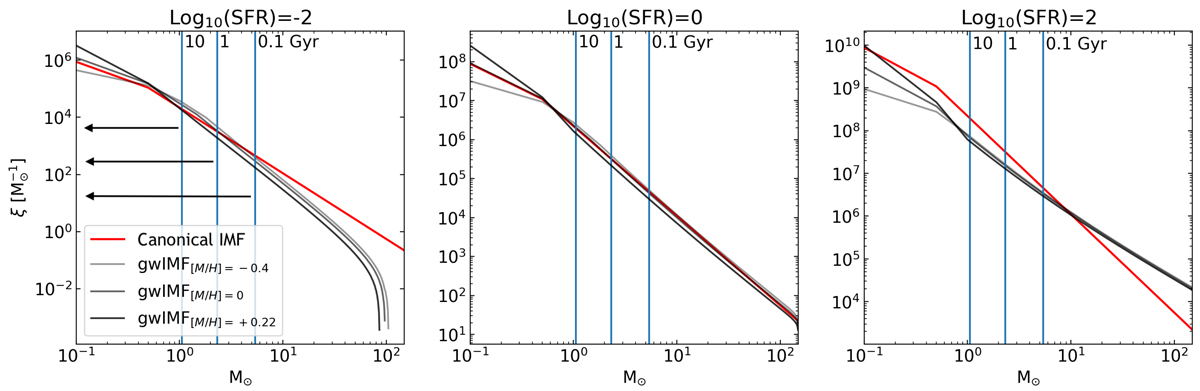
Download original image
Collection of IMFs (normalised to have the same mass). Columns correspond to log10(SFR) = −2, 0 and 2. Each panel shows the number of stars per mass interval: canonical IMF in red and gwIMF in a gradient of greys for each metallicity ([M/H] = −0.4, 0, and 0.22), from lightest to darkest. The vertical blue lines represent the mass of the most massive surviving star when the age of the population is 10, 1, and 0.1 Gyr, corresponding to ≈1.1, 2.3 and 5.4 M⊙ in each case (assuming solar metallicity). We note that only stars with masses lower than the mass of the most massive surviving star will contribute to the spectra, as the horizontal arrows of the first panel show. The normalisation is performed as explained in Sect. 2.4.
Current usage metrics show cumulative count of Article Views (full-text article views including HTML views, PDF and ePub downloads, according to the available data) and Abstracts Views on Vision4Press platform.
Data correspond to usage on the plateform after 2015. The current usage metrics is available 48-96 hours after online publication and is updated daily on week days.
Initial download of the metrics may take a while.