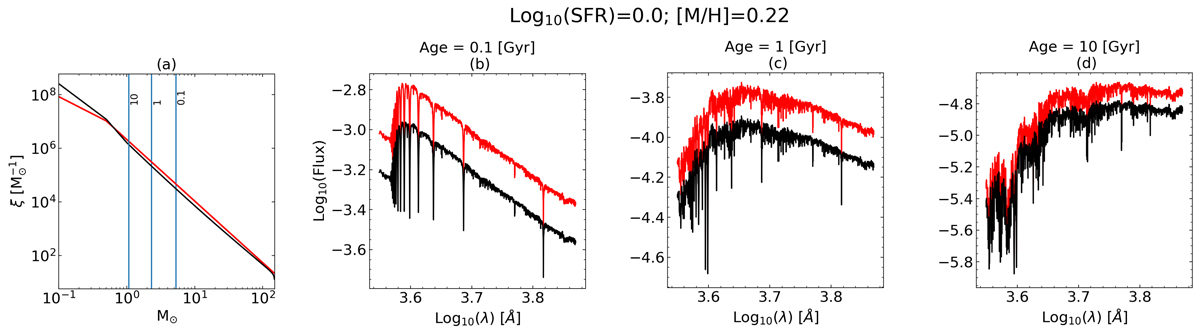
Fig. 4.
Download original image
Bottom-heavy IMF case (log10(SFR) = 0; [M/H] = 0.22). Panel (a) shows the number of stars per mass interval. The canonical IMF is in red, and the gwIMF is in black (normalised to have the same mass, as Sect. 2.4 shows). The vertical blue lines represent the mass of the most massive surviving star at 10, 1, and 0.1 Gyr (from left to right). Panels (b), (c), and (d) present the spectra for 0.1, 1, and 10 Gyr, respectively. For the spectra, the canonical IMF is in red and the gwIMF is in black, as before.
Current usage metrics show cumulative count of Article Views (full-text article views including HTML views, PDF and ePub downloads, according to the available data) and Abstracts Views on Vision4Press platform.
Data correspond to usage on the plateform after 2015. The current usage metrics is available 48-96 hours after online publication and is updated daily on week days.
Initial download of the metrics may take a while.