Fig. 1.
Download original image
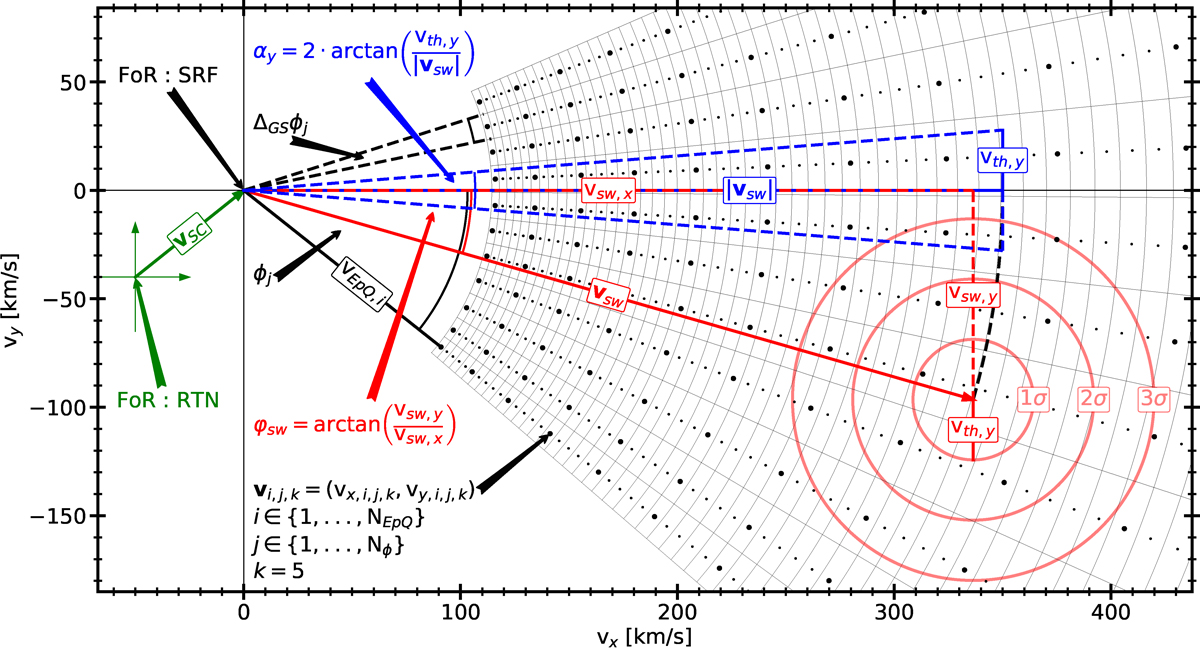
Example of a 2D cut of a velocity phase-space scan is shown. The black dots mark the central position of instrumental bins (vx, i, j, k, vy, i, j, k) that are scanned, with i ∈ [1, …, NEpQ], j ∈ [1, …, Nϕ], NEQP as the number of energy-per-charge (EpQ) steps and Nϕ as the number of azimuthal bins, the angle of inflow bin ϕj of the jth azimuthal bin, and its corresponding bin width ΔGSϕj. As an example for a solar wind instrument the calibration values of the central elevation bin k = 5 of PAS for protons are used here and in Fig. 3. Note that we explicitly differentiate between the instrumental properties (ϕ, θ), and the measured angles (φsw, obs and ϑsw, obs). All instrumental characteristics are shown in black including the utilised Frame of Reference (FoR). Dots illustrate the shells centred at the origin, i.e. in the Spacecraft Reference Frame (SRF), which are scanned by the electrostatic analyser. Each 5th electrostatic analyser step is enlarged for clarity. The shape of each instrumental bin is illustrated with a concentric grid. The instrumental resolution in velocity space becomes coarser with increasing shell radius. In red, an example of a thermalised Maxwell-Boltzmann VDF (see Eq. (6)) is depicted. Shown are the bulk-flow vector relative to the instrument vsw, its components, vsw, x, vsw, y, and the thermal velocity vth. The corresponding 1σ, 2σ, and 3σ environments of the distribution are indicated in light red. In blue, measurement quantities are shown: the absolute value of the solar wind bulk velocity |vsw|, the y component of the thermal speed vth, y, and the corresponding thermal angle αy. The two relevant FoRs are depicted in the left part of the figure: the SRF in black and the Radial-Tangential-Normal Frame (RTN) frame in green. Therein, the tangential components points in the direction of the spacecraft eigenvelocity.
Current usage metrics show cumulative count of Article Views (full-text article views including HTML views, PDF and ePub downloads, according to the available data) and Abstracts Views on Vision4Press platform.
Data correspond to usage on the plateform after 2015. The current usage metrics is available 48-96 hours after online publication and is updated daily on week days.
Initial download of the metrics may take a while.